Free Access
Fig. 6.
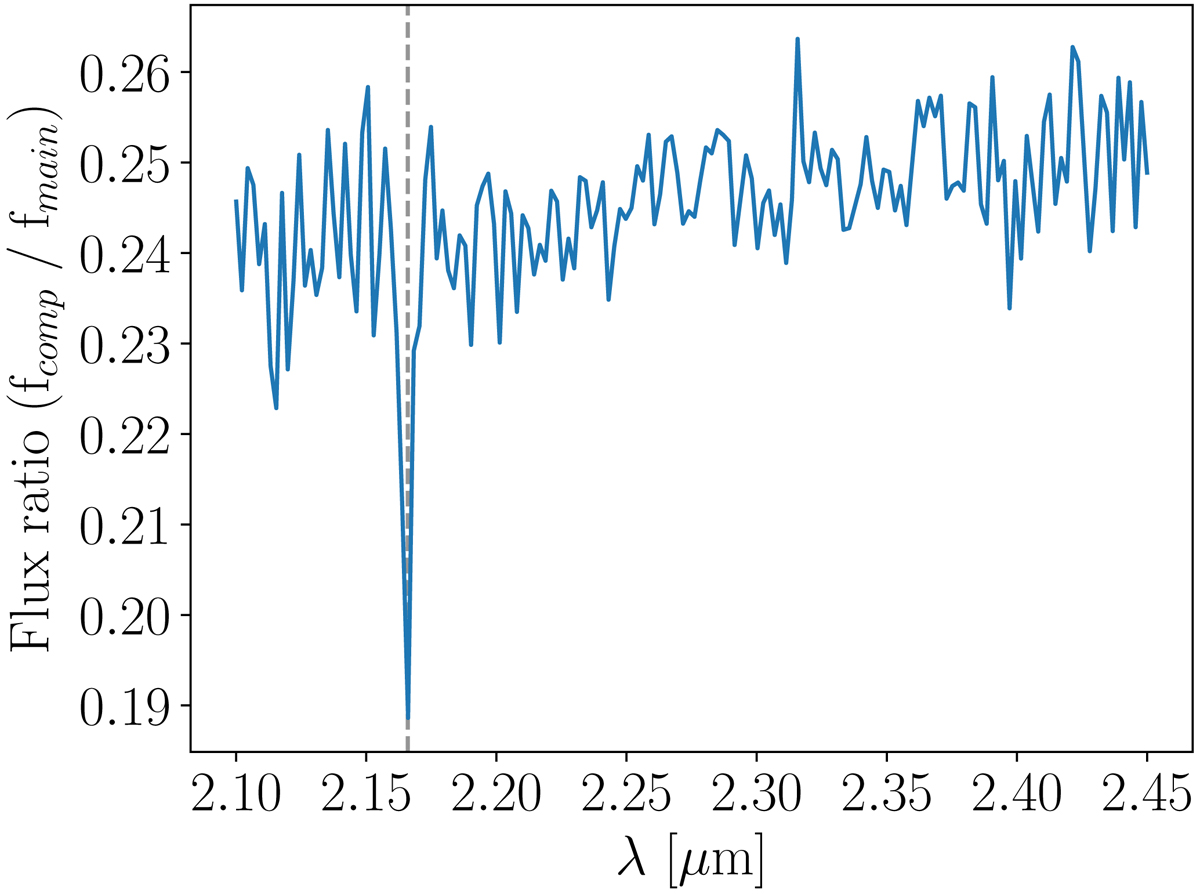
Flux ratio f = fC2/fC1 as a function of observed wavelength. The vertical dashed gray line is at 2.166 microns, the Br-γ line. The drop indicates that C1 has a much higher flux at that wavelength than C2. Data were observed at January 9th 2016.
Current usage metrics show cumulative count of Article Views (full-text article views including HTML views, PDF and ePub downloads, according to the available data) and Abstracts Views on Vision4Press platform.
Data correspond to usage on the plateform after 2015. The current usage metrics is available 48-96 hours after online publication and is updated daily on week days.
Initial download of the metrics may take a while.