Fig. 9.
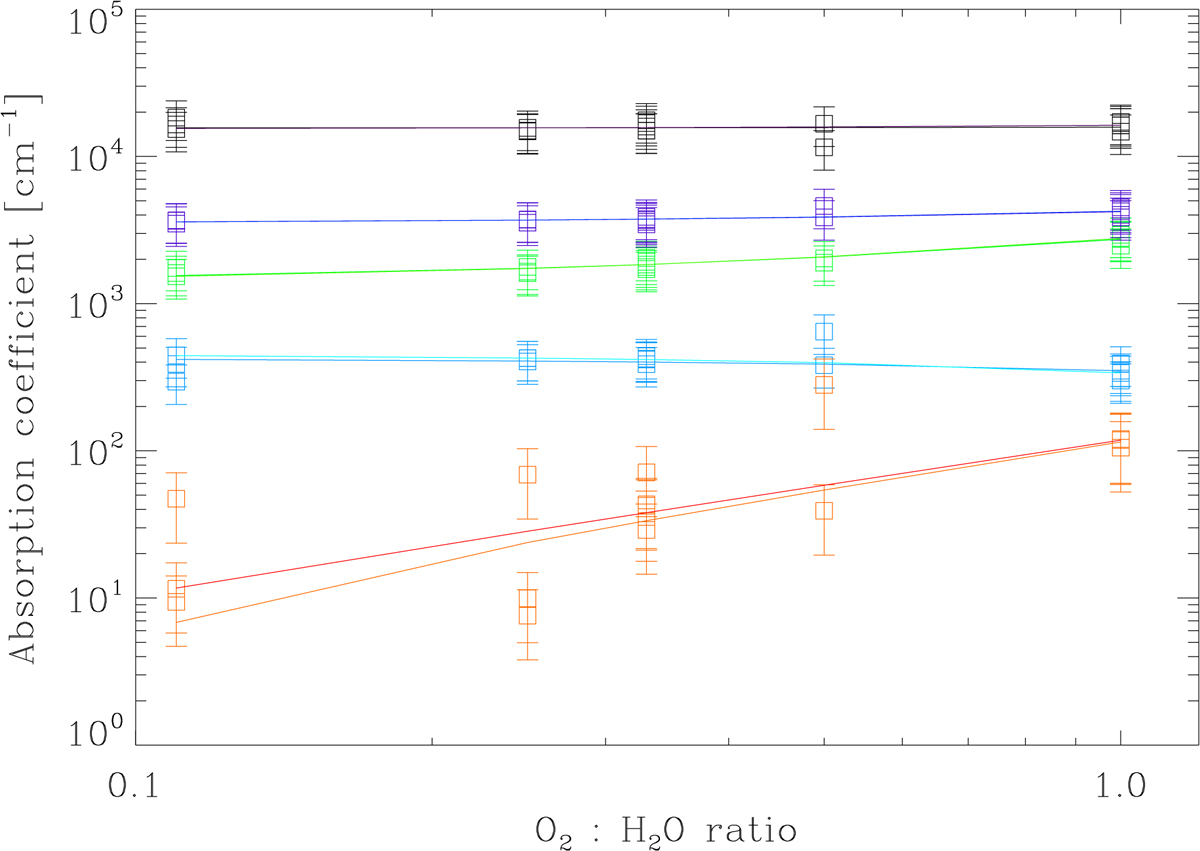
Absorption coefficients of the 3280 cm−1 (black), 2200 cm−1 (light blue), 1660 cm−1 (green), 760 cm−1 (dark blue) water and 1551 cm−1 (red) O2 bands for the different mixture ratios of O2 and H2O. The data were fit using the (a) minimizing χ2-error statistics (bright coloured fits) and (b) “robust” least absolute deviation method (dark coloured fits).
Current usage metrics show cumulative count of Article Views (full-text article views including HTML views, PDF and ePub downloads, according to the available data) and Abstracts Views on Vision4Press platform.
Data correspond to usage on the plateform after 2015. The current usage metrics is available 48-96 hours after online publication and is updated daily on week days.
Initial download of the metrics may take a while.