Fig. 3.
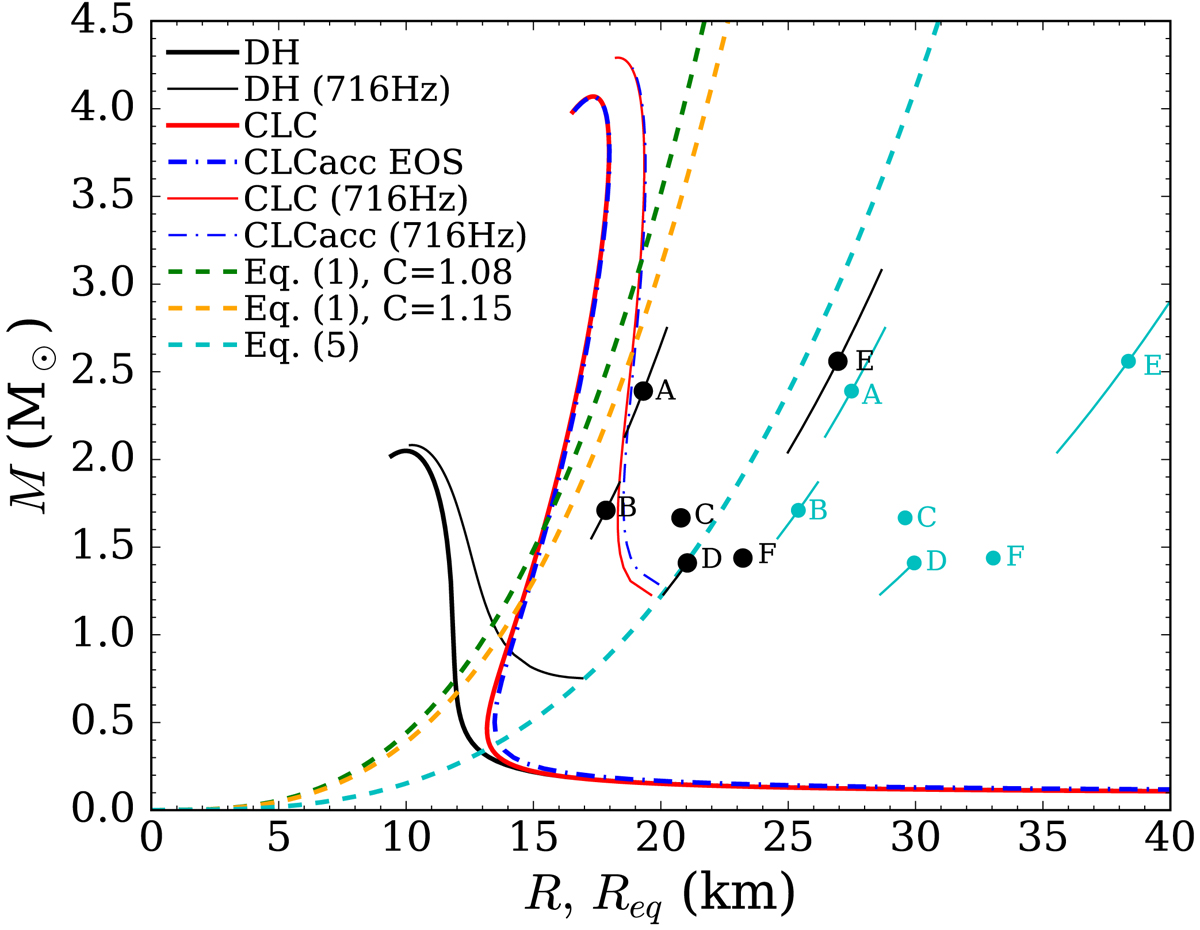
Mass–radius relations for non-rotating stars for the CL EOS (red) with the crust calculated in Douchin & Haensel (2001; DH) connected at ρu = ρ0. For reference we plot the M–R relation obtained for the DH EOS. Dashed lines correspond to Eq. (1) for f = 716 Hz (with two values of the factor C = 1.08, appropriate for standard hadronic matter, and C = 1.15, which is used for self-bound stars and is also appropriate for our maximally stiff CL EOS) and Eq. (4) for f = 716 Hz (the radius is here the equatorial radius of a rotating star). The crossing point between the theoretical M(R) curves and the dashed curves corresponds to the minimum mass for which the mass-shedding frequency of a star described by the chosen EOS could be f = 716 Hz. Black points are observational limits from pulsars for which there are simultaneous frequency measurements and mass determinations, with the error bars determined by the uncertainty on mass, obtained by applying Eq. (1), whereas cyan points correspond to Eq. (4). The letters denote the following rapidly spinning pulsars: A – B1957+20 (622.12 Hz), B – J1023+0038 (592.42 Hz), C – J1903+0327 (465.14 Hz), D – J2043+1711 (420.19 Hz), E – J1311–3430 (390.57 Hz), and F – J0337+1715 (365.95 Hz). Theoretical M(R) relations should be located on the left side of the observed pulsar to be consistent with its parameters. The more constraining points correspond to faster pulsars, so that the detection of objects rotating at frequencies above ∼1 kHz would begin to constrain our CL EOS and more generally the physics of dense matter in the stellar interior.
Current usage metrics show cumulative count of Article Views (full-text article views including HTML views, PDF and ePub downloads, according to the available data) and Abstracts Views on Vision4Press platform.
Data correspond to usage on the plateform after 2015. The current usage metrics is available 48-96 hours after online publication and is updated daily on week days.
Initial download of the metrics may take a while.