Fig. 2.
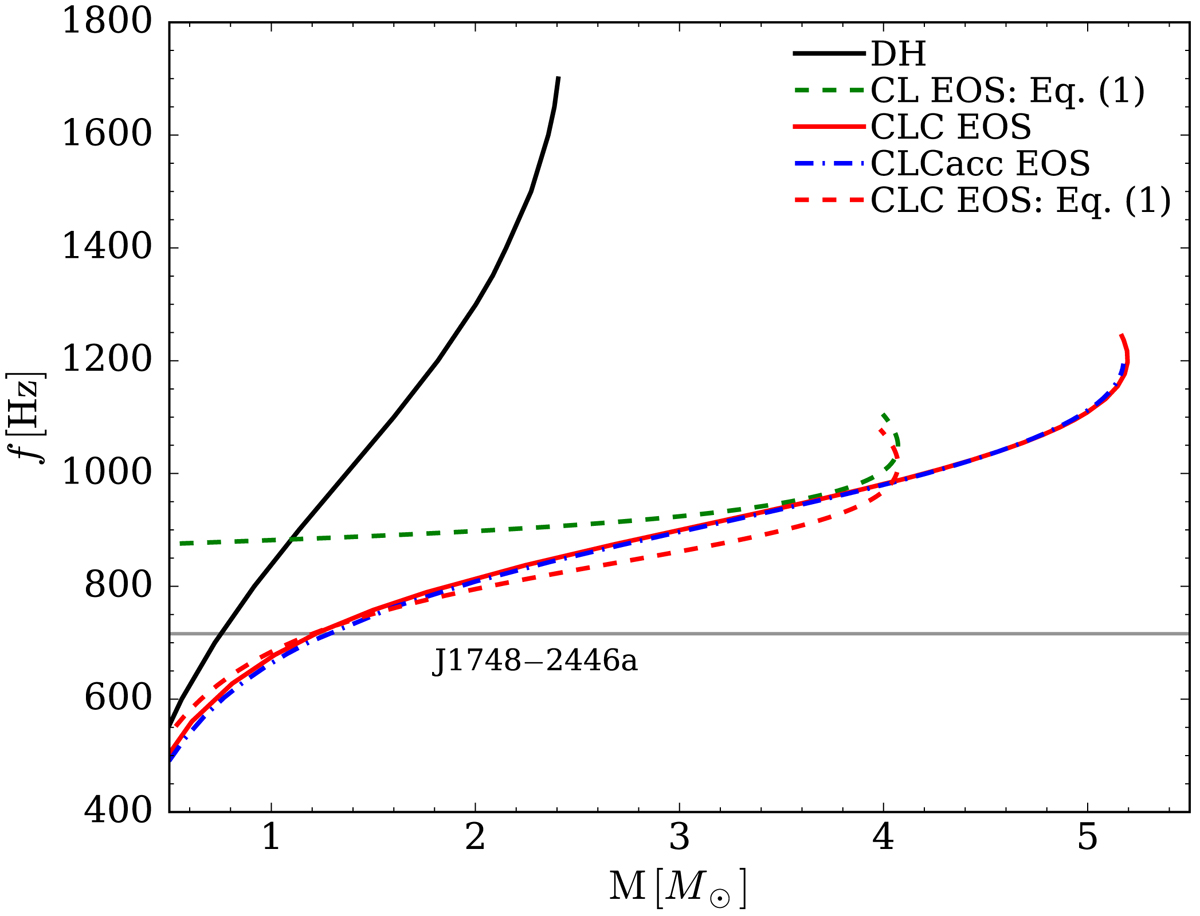
Mass-shedding frequency vs. mass for the same EOSs as in Fig. 1. For the CLC EOS we plot both the curves obtained with the approximate expression in Eq. (3) from a static configuration and exact numerical solutions for rotating configurations obtained with LORENE. For the DH EOS, configurations also obtained with LORENE are plotted. The maximum mass close to the mass-shedding frequency increases significantly due to the additional rotational support, but the error on the frequency remains small, around 10%. For the most extreme configuration that is physically plausible, the CL EOS with crust, the mass-shedding frequency is around 1200 Hz, well above the observed maximum of f = 716 Hz. As this is the stiffest equation of state that can be built, any softening will lead to a higher mass-shedding frequency, as can be seen by comparing to the curve for the more realistic DH equation of state, which reaches mass shedding around f ≃ 1730 Hz.
Current usage metrics show cumulative count of Article Views (full-text article views including HTML views, PDF and ePub downloads, according to the available data) and Abstracts Views on Vision4Press platform.
Data correspond to usage on the plateform after 2015. The current usage metrics is available 48-96 hours after online publication and is updated daily on week days.
Initial download of the metrics may take a while.