Fig. 7.
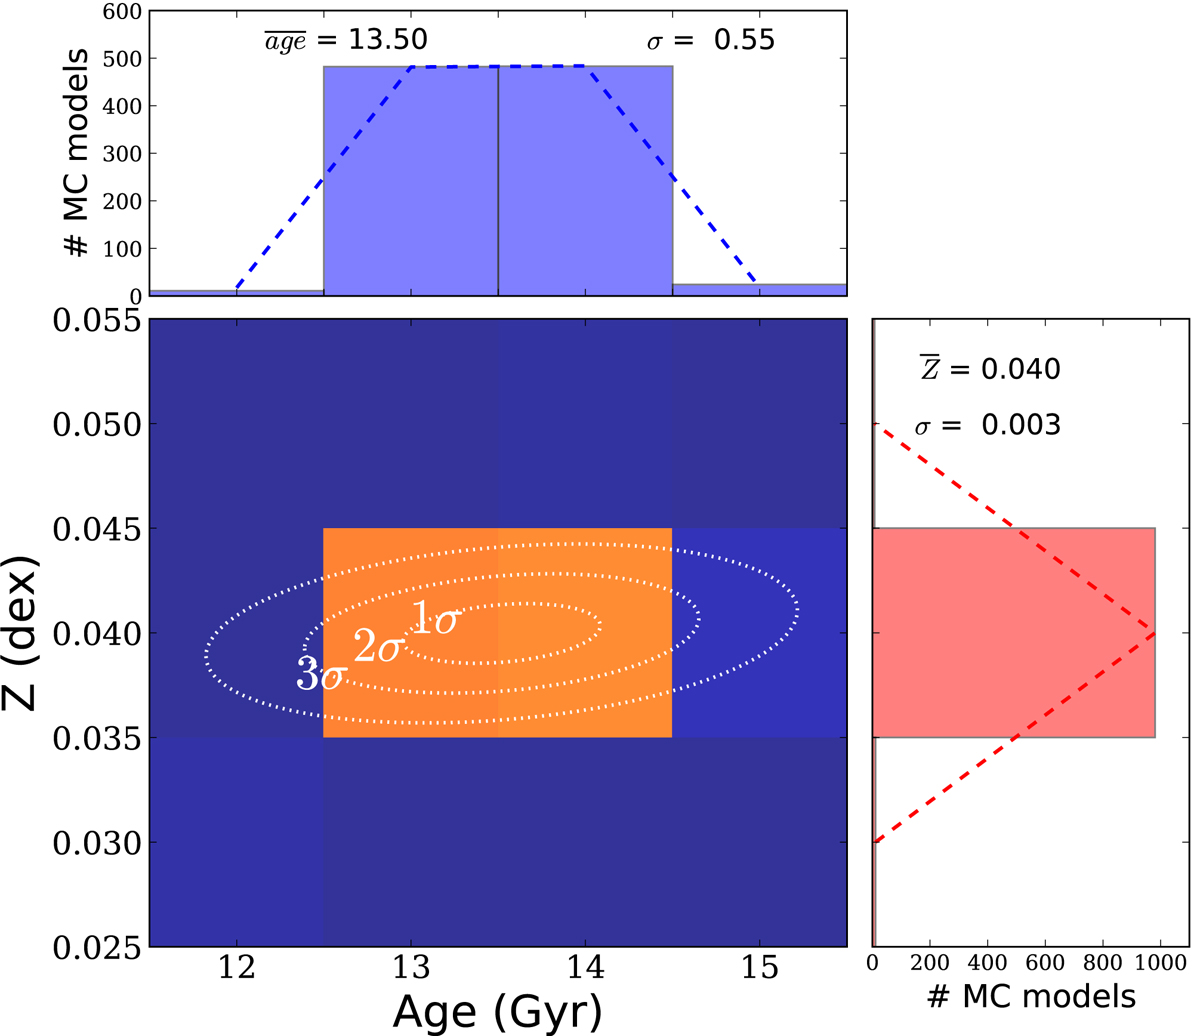
Distribution of ages and metallicities for F2 obtained by fitting 1000 MC samples with the theoretical BaSTI LFs. Upper panel: age distribution. Right panel: metallicity distribution. Central panel: density map of ages and metallicities. Sigma contours are over-plotted in white. Dashed lines show Gaussian fits for ages and metallicities with the values specified in the panels. Accounting for atomic diffusion would reduce the age of the models ∼0.7 − 1 Gyr (see main text).
Current usage metrics show cumulative count of Article Views (full-text article views including HTML views, PDF and ePub downloads, according to the available data) and Abstracts Views on Vision4Press platform.
Data correspond to usage on the plateform after 2015. The current usage metrics is available 48-96 hours after online publication and is updated daily on week days.
Initial download of the metrics may take a while.