Fig. 4.
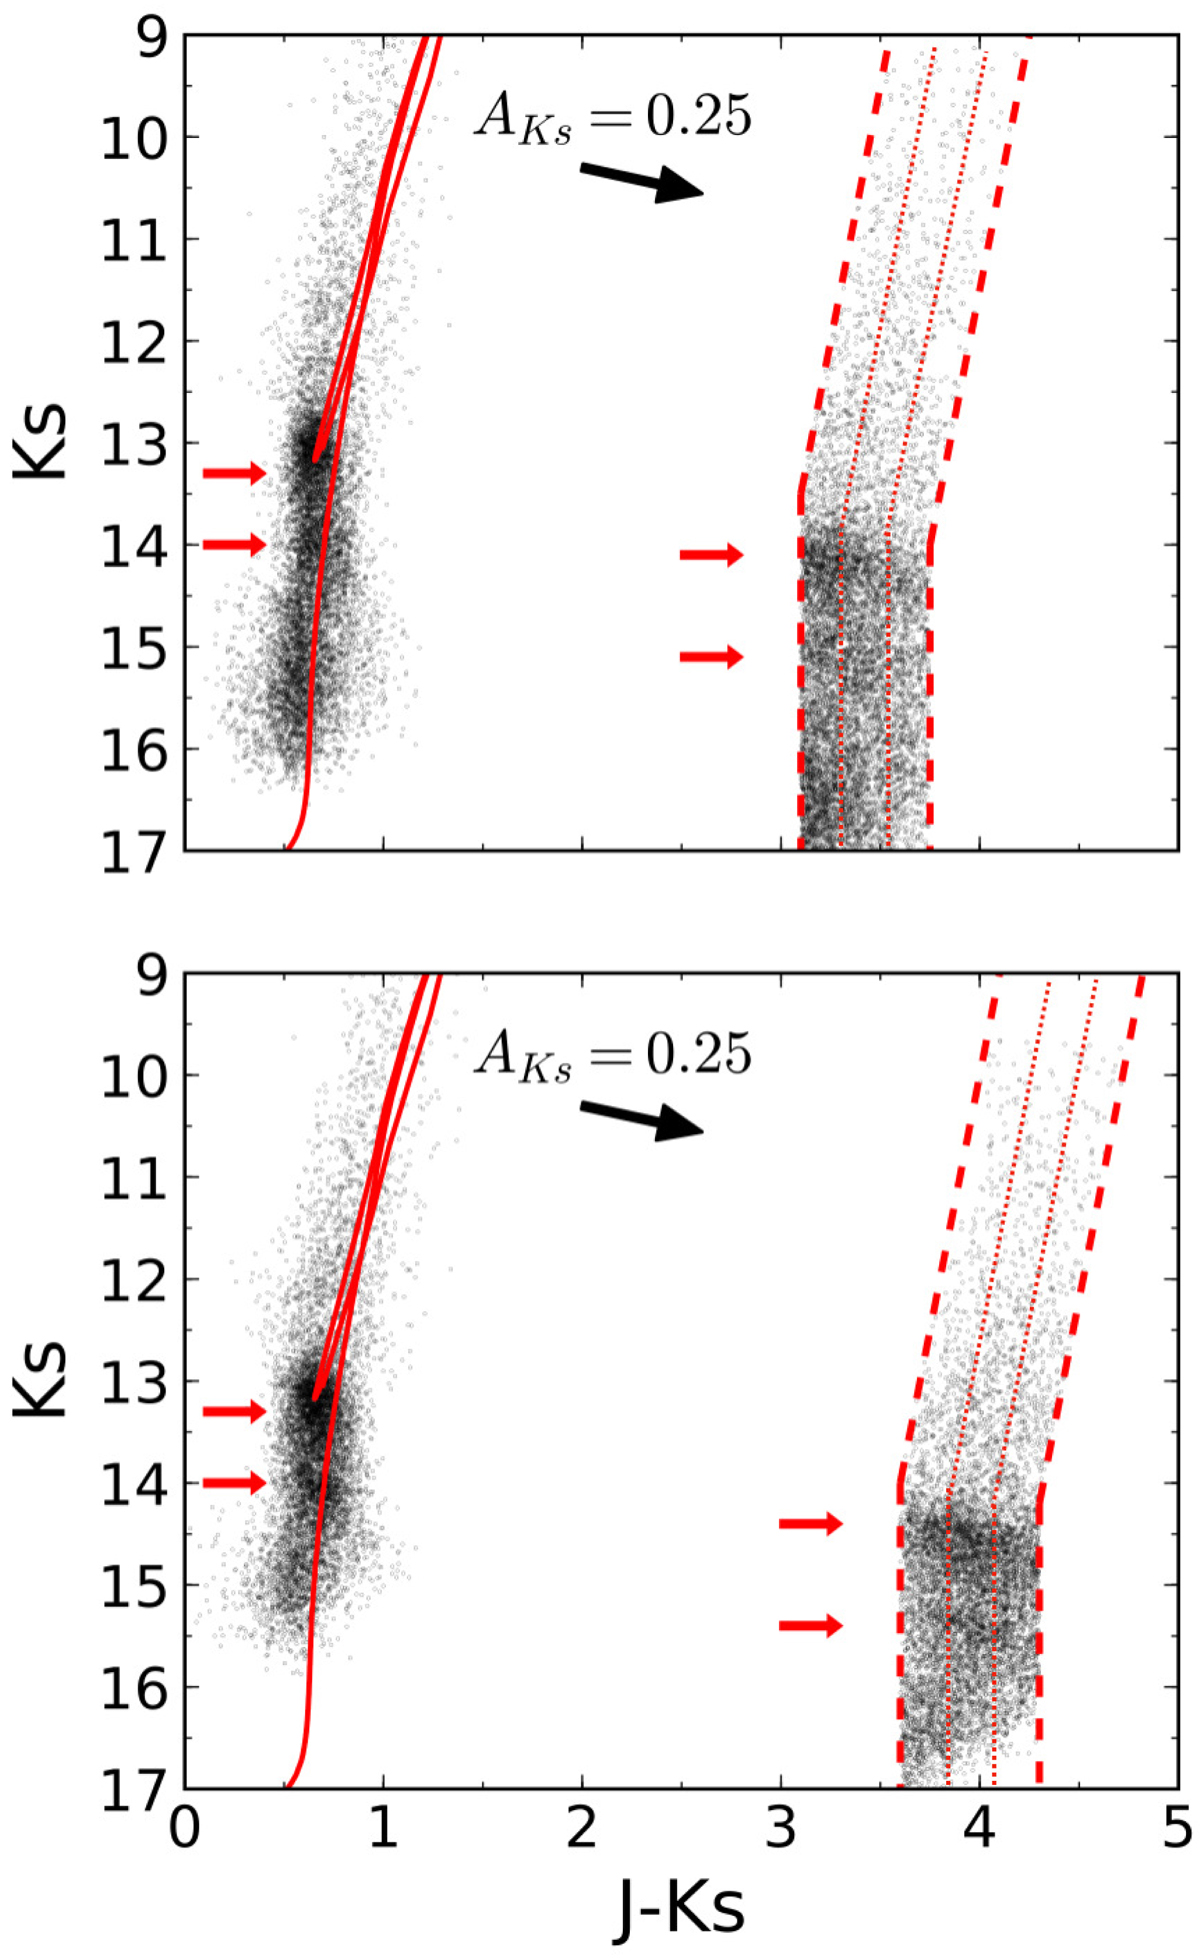
CMD Ks vs. J − Ks with and without extinction correction. Red arrows show the position of the detected features. The black arrow indicates the reddening vector. The red continuous line corresponds to an isochrone of 13.5 Gyr and Z = 0.04 plotted over the de-reddened stars. Upper and lower panels show F1 and F2, respectively. Red dotted lines show different divisions of the data used to produce LFs. Accounting for atomic diffusion would reduce the age of the depicted isochrone ∼0.7 − 1 Gyr (see main text).
Current usage metrics show cumulative count of Article Views (full-text article views including HTML views, PDF and ePub downloads, according to the available data) and Abstracts Views on Vision4Press platform.
Data correspond to usage on the plateform after 2015. The current usage metrics is available 48-96 hours after online publication and is updated daily on week days.
Initial download of the metrics may take a while.