Free Access
Fig. 3.
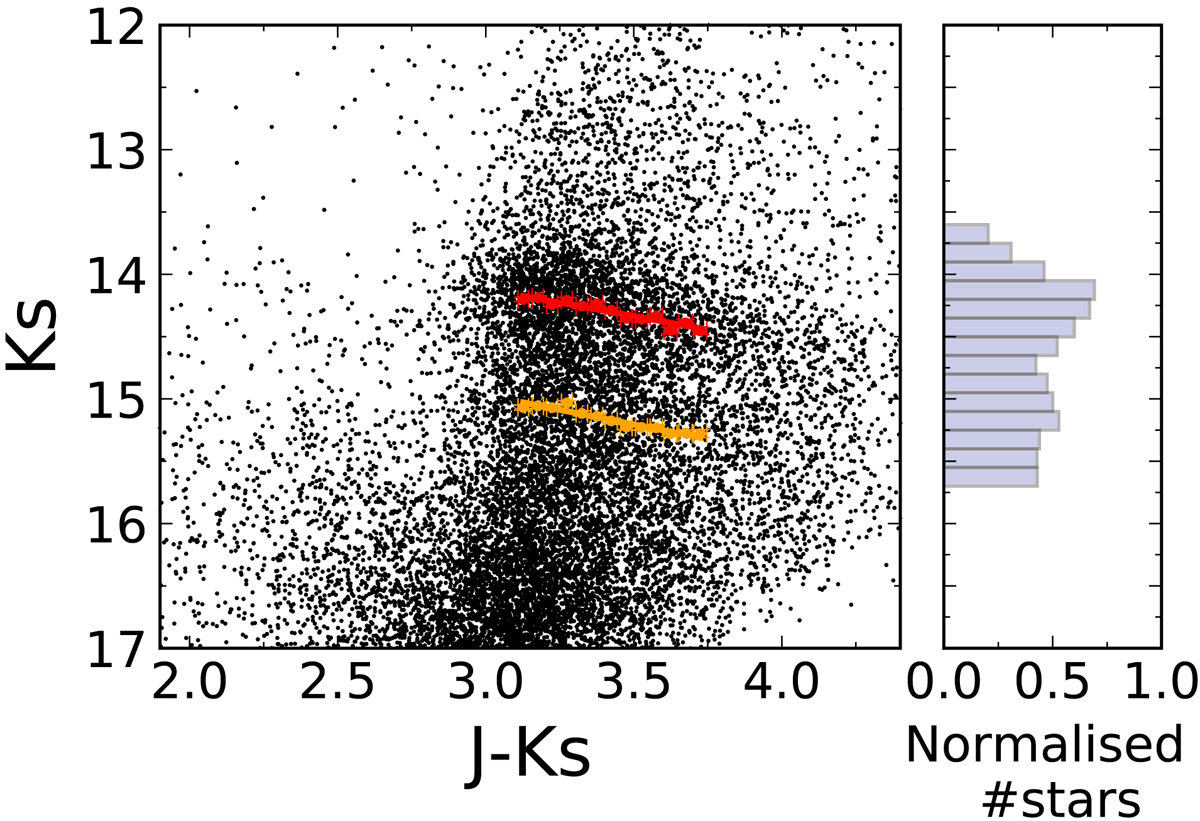
Derivation of the slopes for F1. Main panel: CMD for F1. Red and orange lines indicate the mean values obtained using the GMM and linear fits in several bins 0.05 mag wide in colour. Right panel: normalised histogram of all the stars in J − Ks ∈ [3.1, 3.75] and Ks ∈ [13.6, 15.7].
Current usage metrics show cumulative count of Article Views (full-text article views including HTML views, PDF and ePub downloads, according to the available data) and Abstracts Views on Vision4Press platform.
Data correspond to usage on the plateform after 2015. The current usage metrics is available 48-96 hours after online publication and is updated daily on week days.
Initial download of the metrics may take a while.