Free Access
Fig. 9.
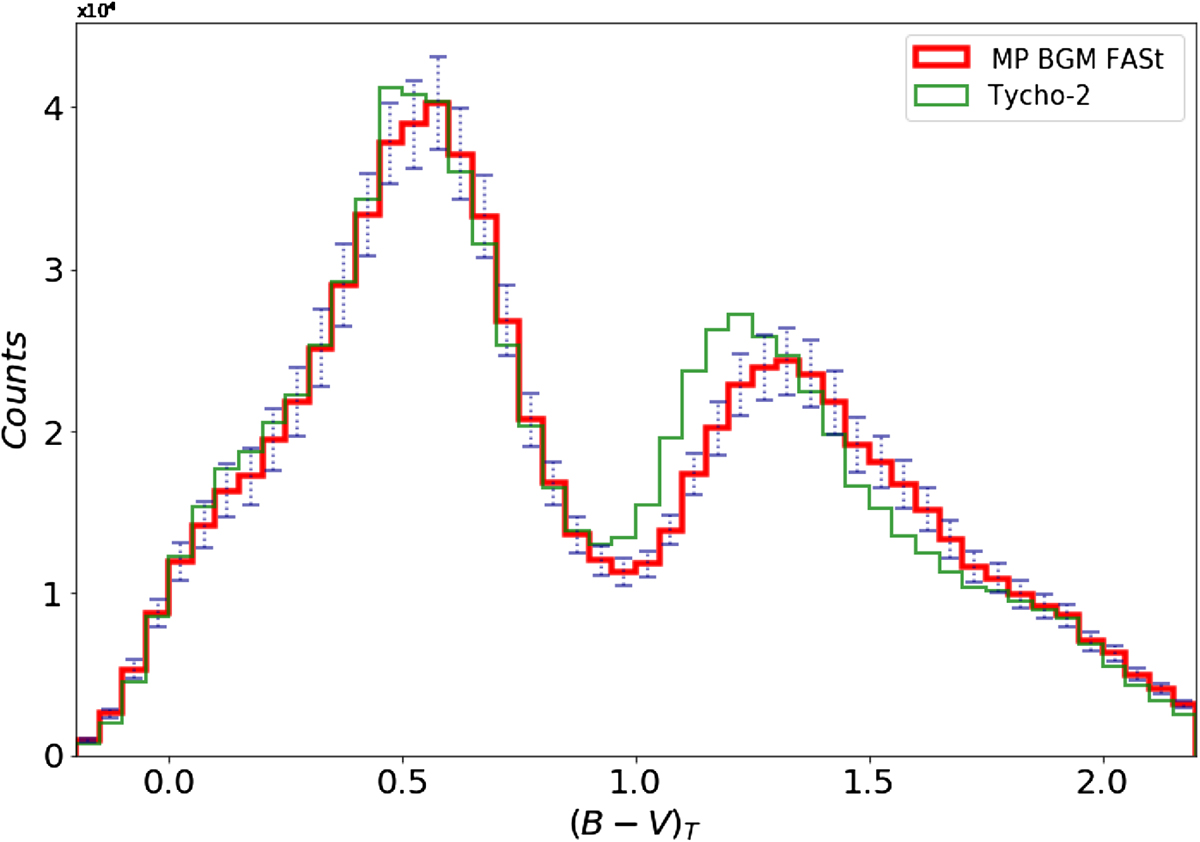
Colour distribution of MP variant and Tycho-2 with a limit in magnitude of VT = 11. Our Bayesian approach allows us to compute the error bars (dotted blue) from the simulations computed using the parameters inside the 1σ level of the posterior PDFs shown in Fig. 6.
Current usage metrics show cumulative count of Article Views (full-text article views including HTML views, PDF and ePub downloads, according to the available data) and Abstracts Views on Vision4Press platform.
Data correspond to usage on the plateform after 2015. The current usage metrics is available 48-96 hours after online publication and is updated daily on week days.
Initial download of the metrics may take a while.