Fig. 8.
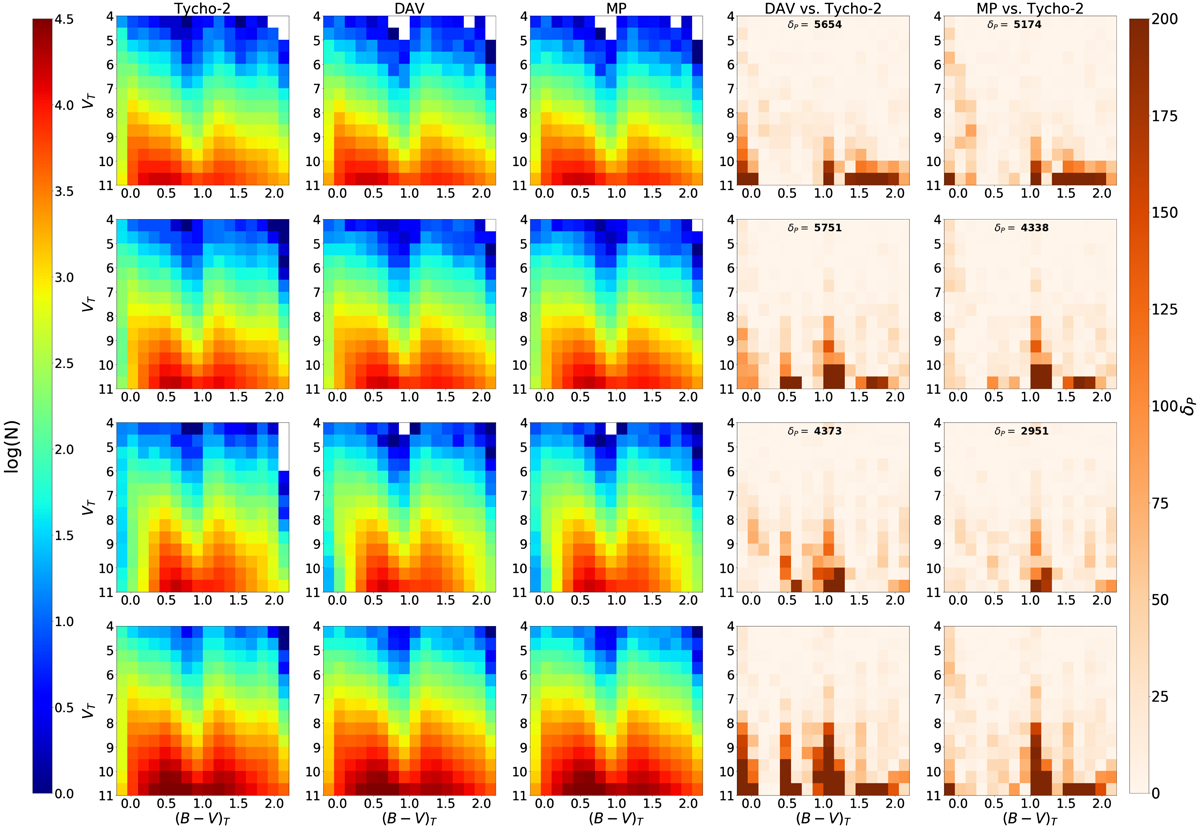
Colour-magnitude diagram ( apparent visual magnitude Tycho (VT) vs. Tycho (B − V)T colour) divided into three latitude ranges: first row: |b|< 10, second row: 10 < |b|< 30 third row: 30 < |b|< 90 and for the whole sky (bottom row). The colour-map of the first, second, and third columns shows the logarithm of the star counts in each bin. First column: Tycho-2 data, second column: best-fit model variant from Mor et al. (2017) (DAV) obtained using Galactic classical Cepheid and Tycho-2 data, and third column: MP variant combination of the most probable value for six parameters explored in Sect. 7.2. The BGM simulations performed for this figure use the Drimmel extinction map. The colour map of the fourth and fifth rows represents the Poissonian distance computed for each bin. The total distance indicated in each plot is the Poissonian distance (δP) computed using Eq. 58. The smaller the value of δP, the better the agreement. fourth column: Poissonian distance between DAV and Tycho-2, and fifth column: Poissonian distance between MP and Tycho-2. Observational data and simulations are samples limited in visual apparent magnitude considering the stars with VT < 11.
Current usage metrics show cumulative count of Article Views (full-text article views including HTML views, PDF and ePub downloads, according to the available data) and Abstracts Views on Vision4Press platform.
Data correspond to usage on the plateform after 2015. The current usage metrics is available 48-96 hours after online publication and is updated daily on week days.
Initial download of the metrics may take a while.