Fig. 5.
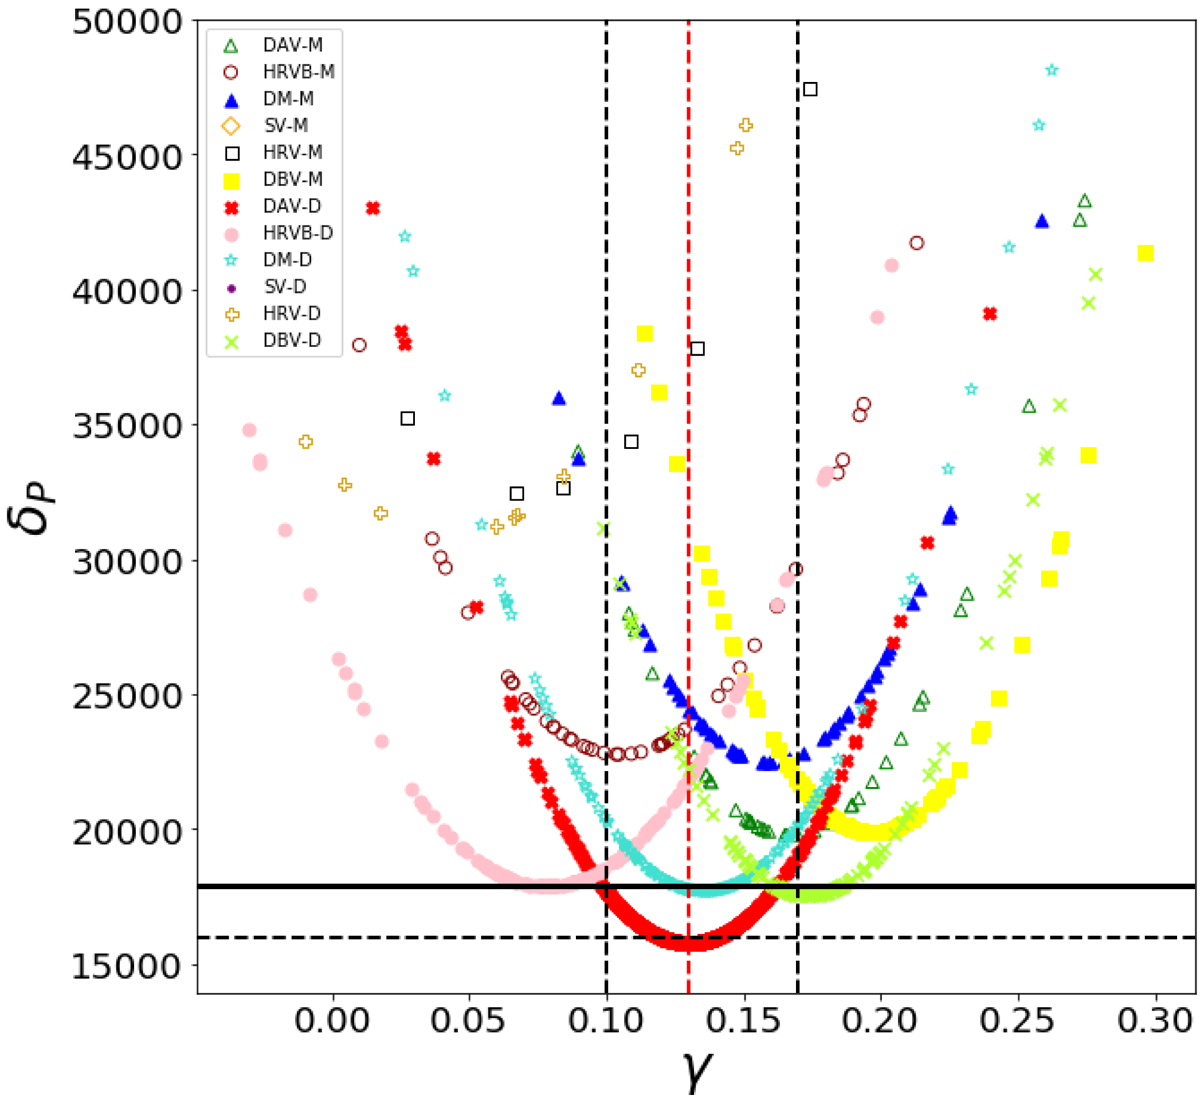
This plot is built from the results of Case A shown in Figs. 6 and 7. Each point in the plot represents a set of parameters accepted by the ABC algorithm as part of the posterior PDF. For each accepted set we plot the Poissonian distance (δP) as a function of the inverse of the characteristic timescale (γ parameter) of an assumed decreasing exponential SFH. δP is computed using the expression of Eq. (58); the smaller the value of δP, the better its agreement with the data. Dotted horizontal line gives the δP value around the best fit (δP ≈ 16 000) and the solid horizontal line is to emphasise the degeneracy for three different sets of parameters of the model variants (see Table 2). The vertical dashed black lines denote the quantile 0.16 (left) and quantile 0.84 (right) for the distribution of Fig. 3. The vertical red dashed line is for the mode of the γ distribution in Fig. 3. We obtain these results when using as observational data the stars in the Tycho-2 catalogue with visual apparent magnitude VT < 11. Variant/extinction map combinations are as described in Fig. 4.
Current usage metrics show cumulative count of Article Views (full-text article views including HTML views, PDF and ePub downloads, according to the available data) and Abstracts Views on Vision4Press platform.
Data correspond to usage on the plateform after 2015. The current usage metrics is available 48-96 hours after online publication and is updated daily on week days.
Initial download of the metrics may take a while.