Fig. 3.
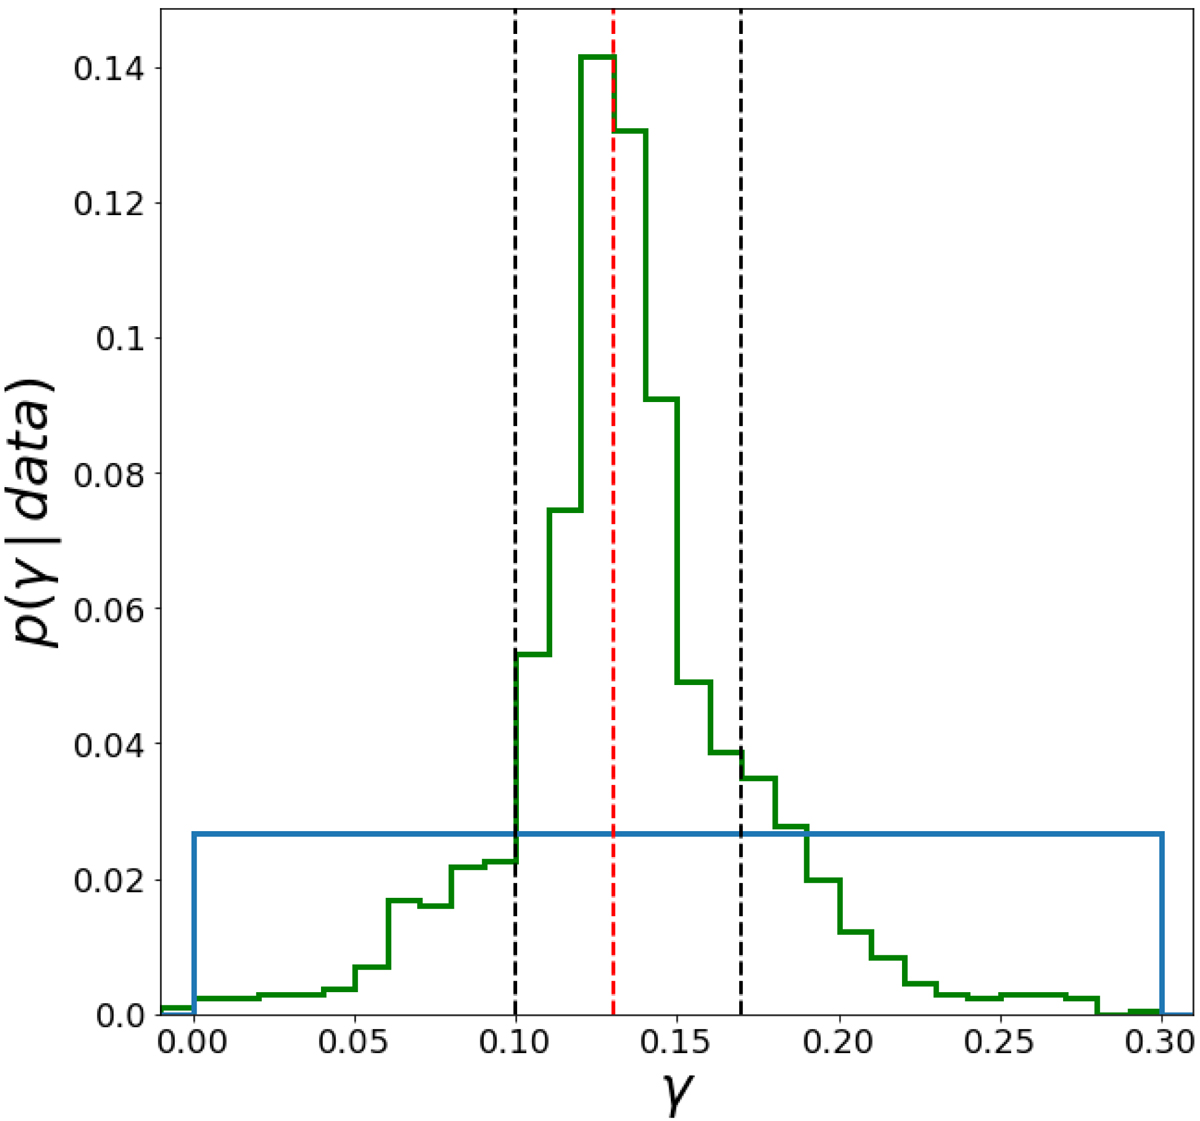
P(γ|data) (in green) Approximate posterior PDF for the γ parameter resulting from case A, given the adopted prior (see text). The vertical red dotted line indicates the mode of the distribution γ = 0.13 with an uncertainty in the range indicated by the two black vertical lines corresponding to the quantiles 0.16 and 0.84, respectively (![]() ). We obtain these results when using as observational data the stars in Tycho-2 catalogue with visual apparent magnitude VT < 11. In blue we show the adopted prior PDF.
). We obtain these results when using as observational data the stars in Tycho-2 catalogue with visual apparent magnitude VT < 11. In blue we show the adopted prior PDF.
Current usage metrics show cumulative count of Article Views (full-text article views including HTML views, PDF and ePub downloads, according to the available data) and Abstracts Views on Vision4Press platform.
Data correspond to usage on the plateform after 2015. The current usage metrics is available 48-96 hours after online publication and is updated daily on week days.
Initial download of the metrics may take a while.