Fig. 2.
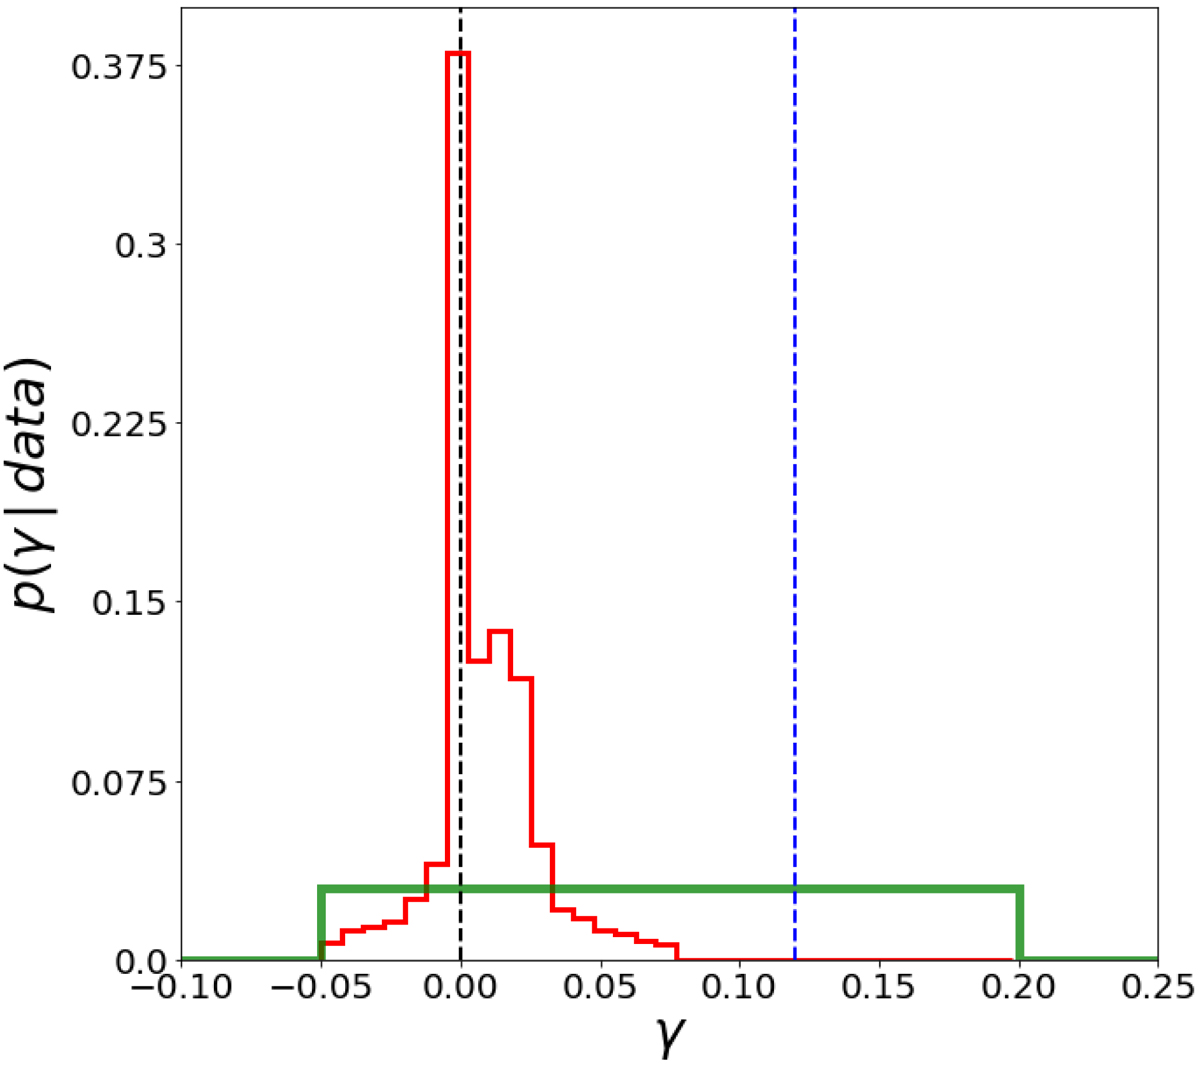
Probability distribution function for the inverse of the characteristic time scale (γ parameter) of the thin disc SFH, assuming a decreasing exponential shape. The right vertical blue dotted line indicates the γ value of the Mother Simulation used in the test. The left black dotted vertical line (γ = 0) indicates the value to be recovered by the test. In green we show the prior PDF assumed for the test (uniform distribution between −0.05 and 0.20). In red we show the resulting approximate posterior PDF P(γ|data).
Current usage metrics show cumulative count of Article Views (full-text article views including HTML views, PDF and ePub downloads, according to the available data) and Abstracts Views on Vision4Press platform.
Data correspond to usage on the plateform after 2015. The current usage metrics is available 48-96 hours after online publication and is updated daily on week days.
Initial download of the metrics may take a while.