Fig. B.1.
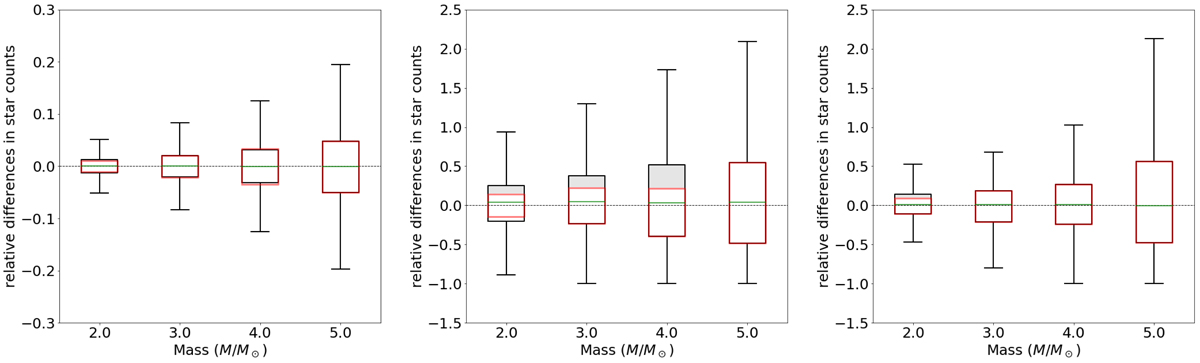
Left panel: behaviour of the noise in BGM Std when the mass reservoir is large. This behaviour is obtained by reproducing a full star generation process of a mass reservoir of 104 M⊙ for the youngest age sub-population 104 times. The limits of the boxes show the position of the first and the third quartile. The limits of the bars show the position of −1.5 ⋅ IQR and +1.5 ⋅ IQR, where IQR is the interquartile range. Everything beyond the limits of the bar is considered an outlier. In black we show the relative differences in star counts between the expected number of stars in a given mass bin and the number of stars obtained with the standard BGM generation strategy. The red boxes show what these relative differences would be if the generation were to precisely follow a Poisson distribution centred in the expected value. The noise behaves approximately as a Poisson distribution, as expected. Middle and right panels: behaviour of the noise in BGM Std when the mass reservoir is small. This is obtained by by reproducing a full star generation process of a mass reservoir of 150 M⊙ for the youngest age sub-population 104 times. This small mass reservoir only appears occasionally. The middle panel is for very flat slopes of the IMF at high mass range (in this case α3 = 2.35). The right panel is for an IMF slope of α3 = 3.2 closer to the best slopes fitting the data. In black we show the relative differences in star counts between the expected number of stars in a given mass bin and the number of stars obtained with the standard BGM generation strategy. The red boxes show what these relative differences would be if the generation were to precisely follow a Poisson distribution centred in the expected value. The grey shadow emphasises the differences between the distribution obtained with BGM Std and the one that would follow exactly a Poisson distribution. We note that the effect is very small for the right panel. We show the results only for masses up to 5.5 M⊙ as about 99% of the stars in the simulated samples (limited at VT = 11) have masses smaller than 5.5 M⊙.
Current usage metrics show cumulative count of Article Views (full-text article views including HTML views, PDF and ePub downloads, according to the available data) and Abstracts Views on Vision4Press platform.
Data correspond to usage on the plateform after 2015. The current usage metrics is available 48-96 hours after online publication and is updated daily on week days.
Initial download of the metrics may take a while.