Fig. A.4.
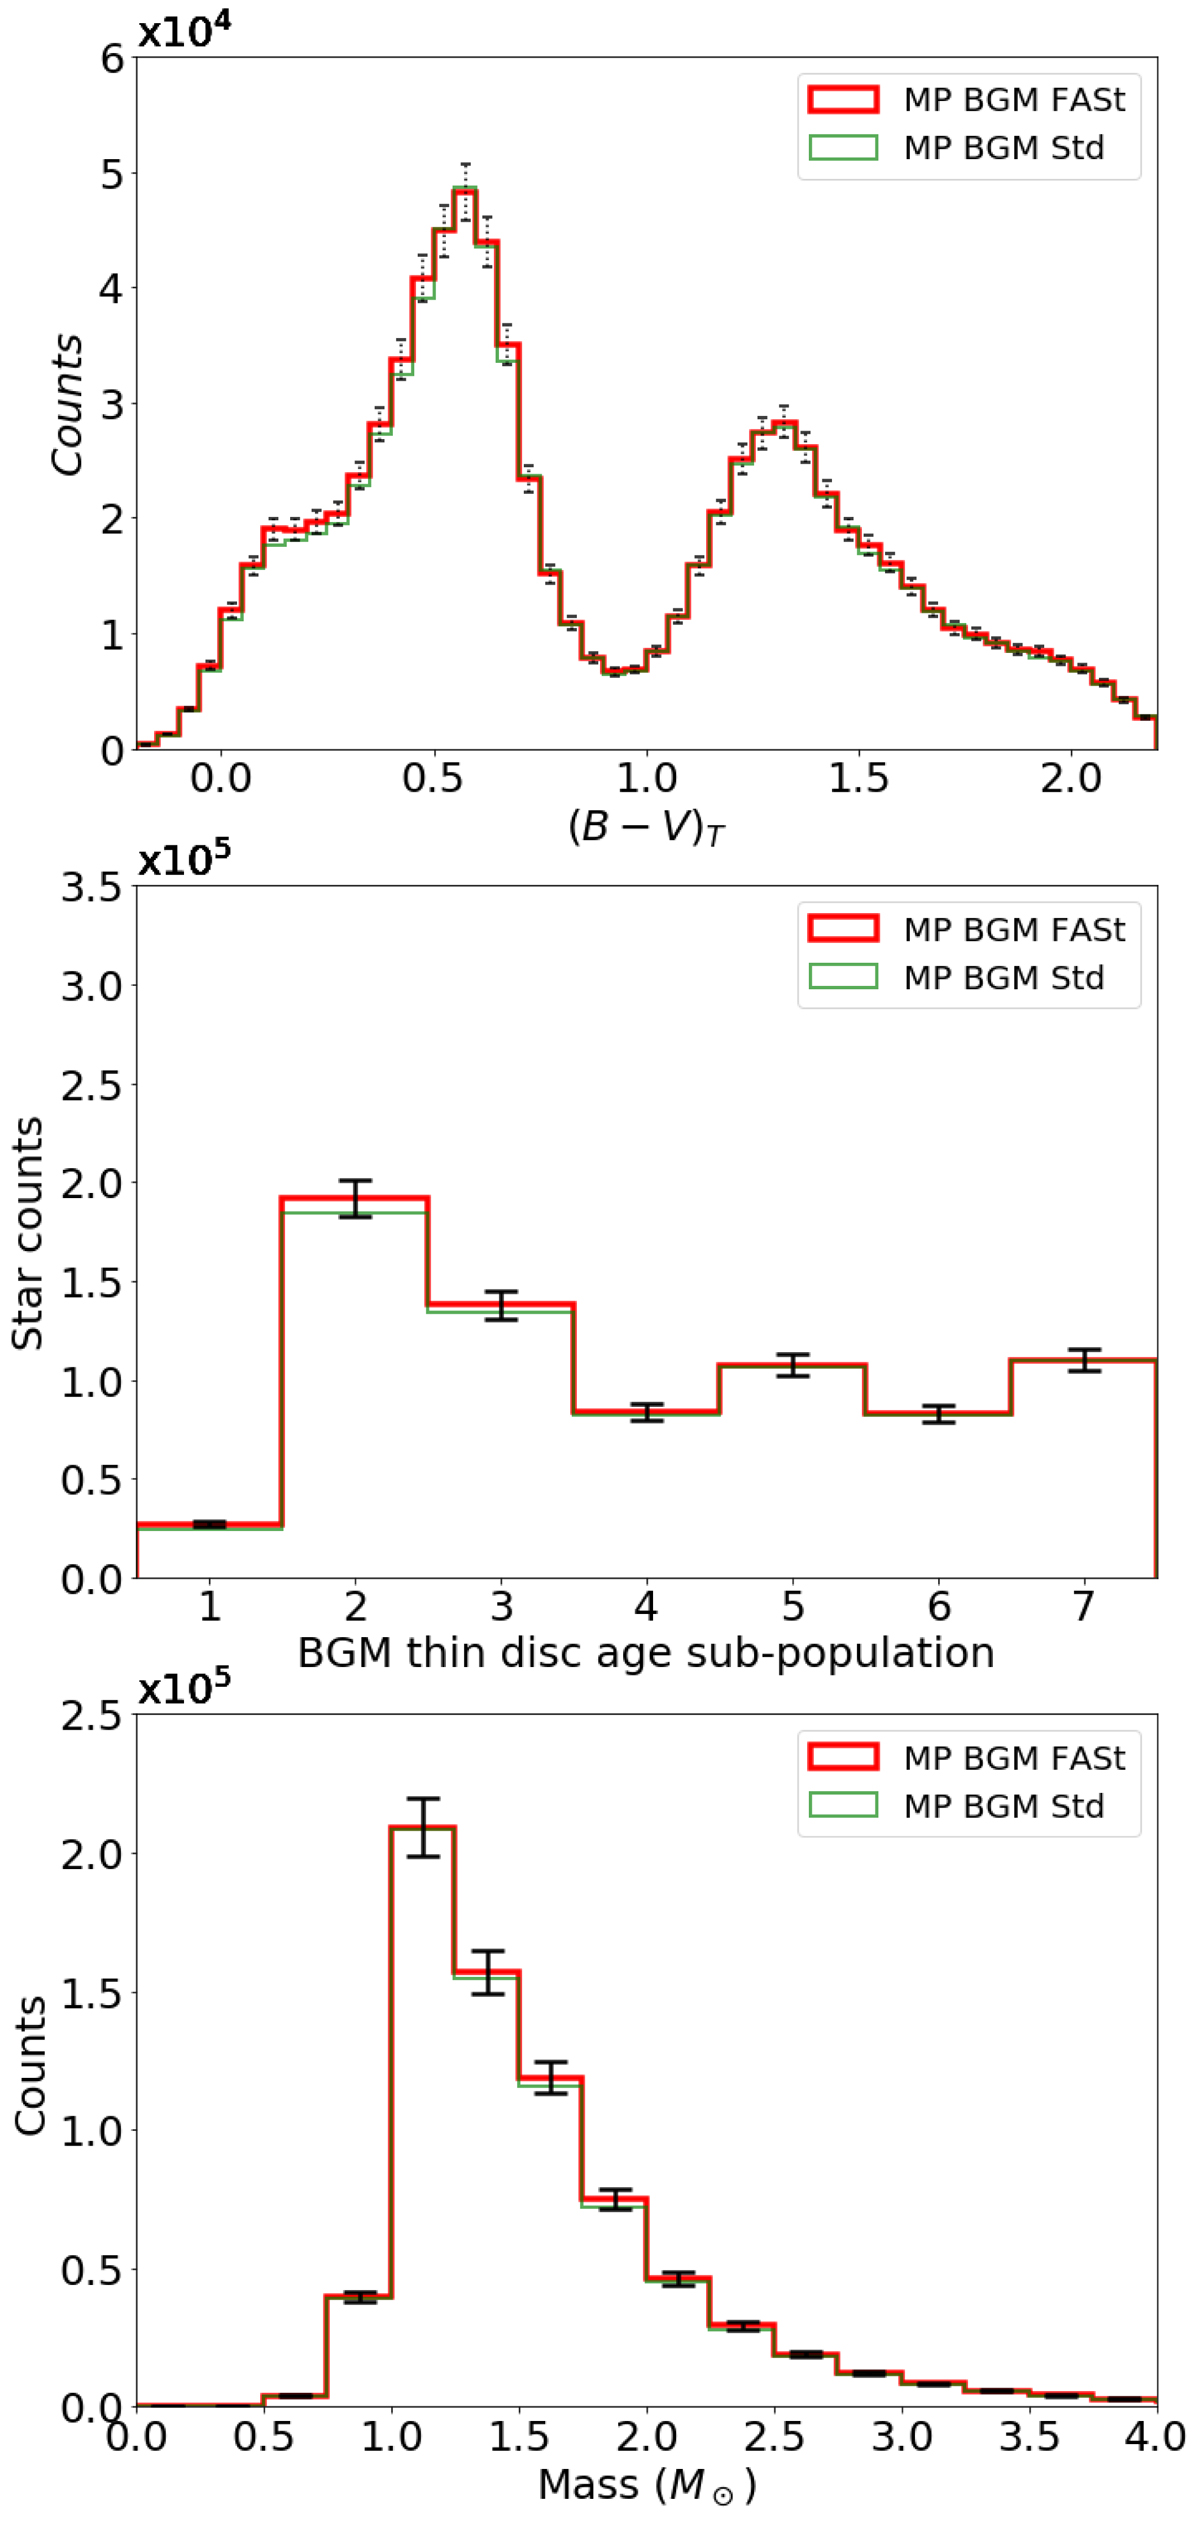
Top panel: (B − V)T distribution. Middle panel: star counts for each of the seven age sub-populations of the thin disc assumed in the BGM. Bottom panel: mass distribution. The simulations are done using the combination of the six most probable parameters (MP variant) with the Drimmel & Spergel (2001) extinction map; in red the simulation is done with BGM FASt while in black it is done with BGM Std. The error bars are set to be 5% of the stars in the bin to visualise that the differences between BGM FASt and BGM Std are below it. The simulations are samples limited in visual apparent magnitude VT < 11 and photometric errors are not considered.
Current usage metrics show cumulative count of Article Views (full-text article views including HTML views, PDF and ePub downloads, according to the available data) and Abstracts Views on Vision4Press platform.
Data correspond to usage on the plateform after 2015. The current usage metrics is available 48-96 hours after online publication and is updated daily on week days.
Initial download of the metrics may take a while.