Fig. 3.
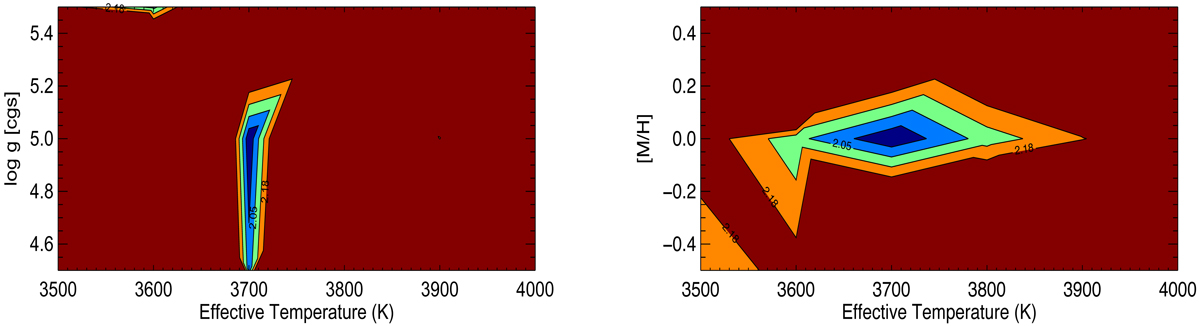
Example of χ2 map for different combinations of Teff, log g and [M/H] for GJ 180 (M1.0). The contour plots in the figure shows the calculated χ2 of the fit based on a grid of Teff, log g and [M/H]. The black lines indicate the Teff, log g and [M/H] with the minimum χ2.
Current usage metrics show cumulative count of Article Views (full-text article views including HTML views, PDF and ePub downloads, according to the available data) and Abstracts Views on Vision4Press platform.
Data correspond to usage on the plateform after 2015. The current usage metrics is available 48-96 hours after online publication and is updated daily on week days.
Initial download of the metrics may take a while.