Fig. 1.
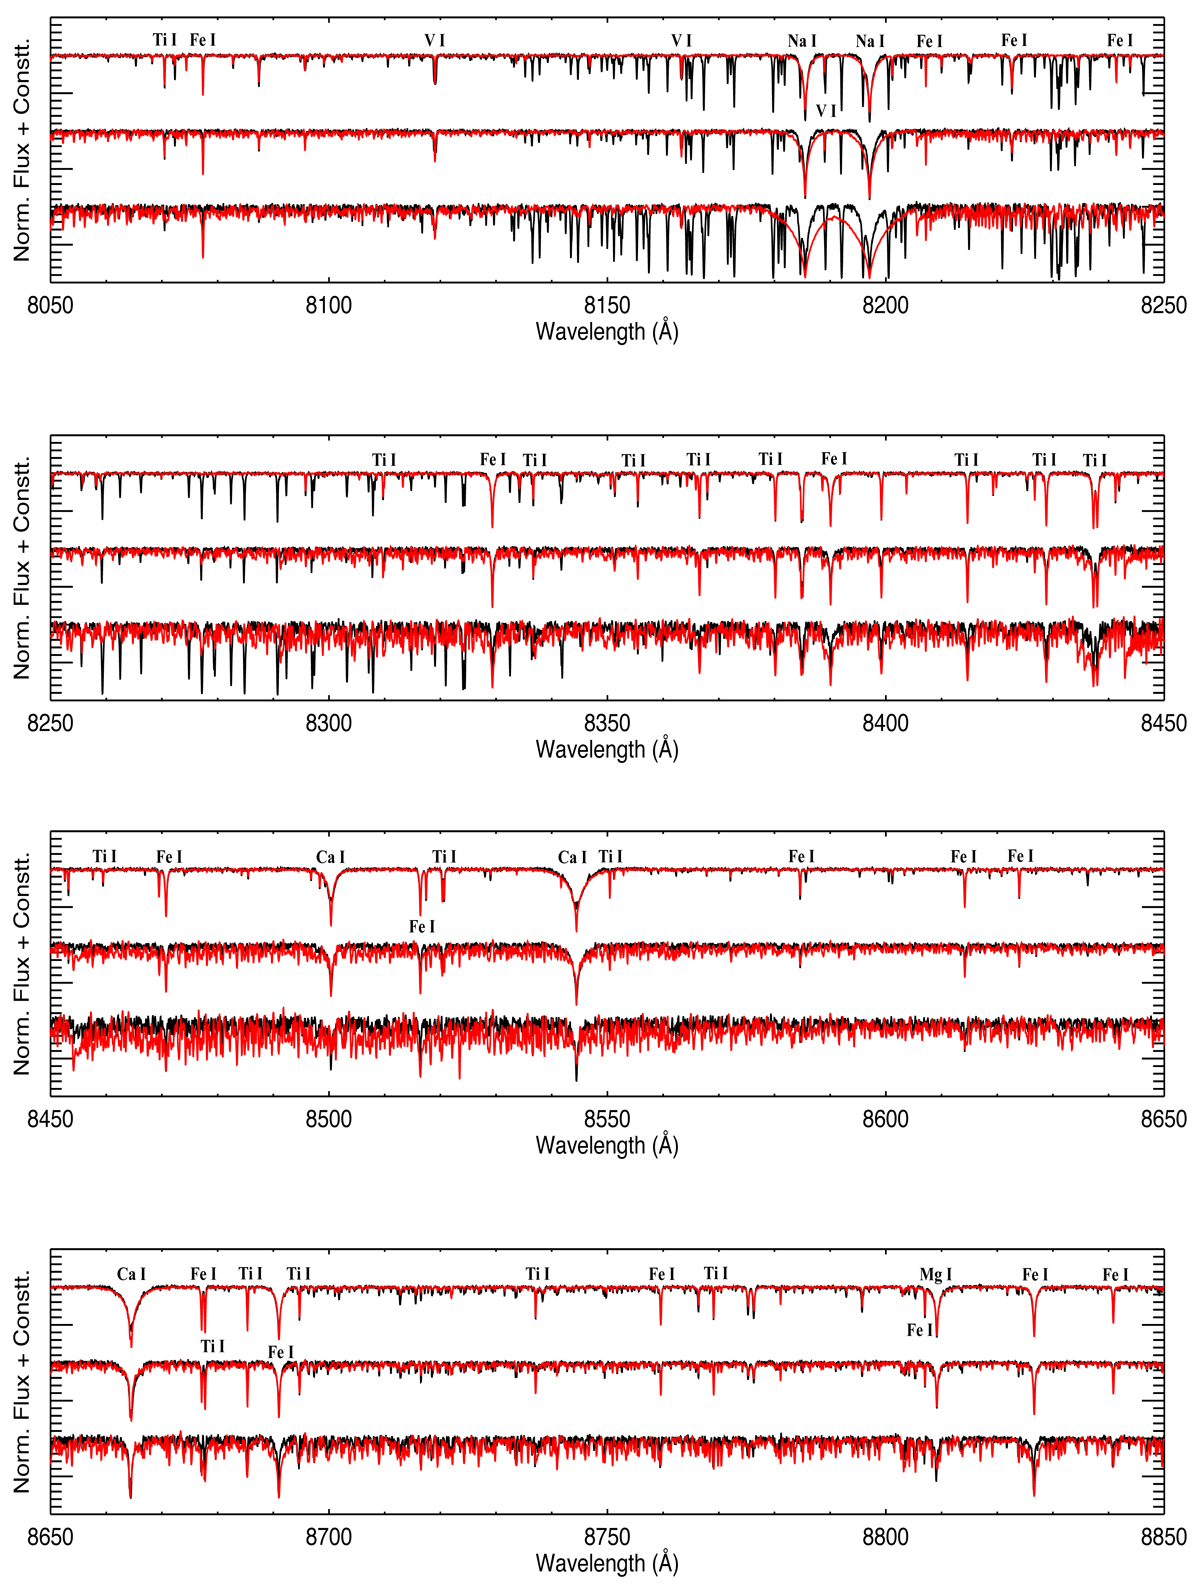
CARMENES spectra of GJ 180 (M1.0, top panel), Ross 128 (M4.0, middle panel), HD 180617 (M8.0, bottom panel) in black is compared with the best-fit BT-Settl model (red). The main spectral features which includes atomic lines such as Fe I, Ca I, Na I, K I, Si I, Mg I, Al II, along with some hydride bands such as those of FeH and OH can be seen. We used mainly Tinney & Reid (1998), Reiners et al. (2018) for the spectral features recognition and labeling. Their best value of Teff, [M/H] and log g is given in Table 2.
Current usage metrics show cumulative count of Article Views (full-text article views including HTML views, PDF and ePub downloads, according to the available data) and Abstracts Views on Vision4Press platform.
Data correspond to usage on the plateform after 2015. The current usage metrics is available 48-96 hours after online publication and is updated daily on week days.
Initial download of the metrics may take a while.