Fig. 6
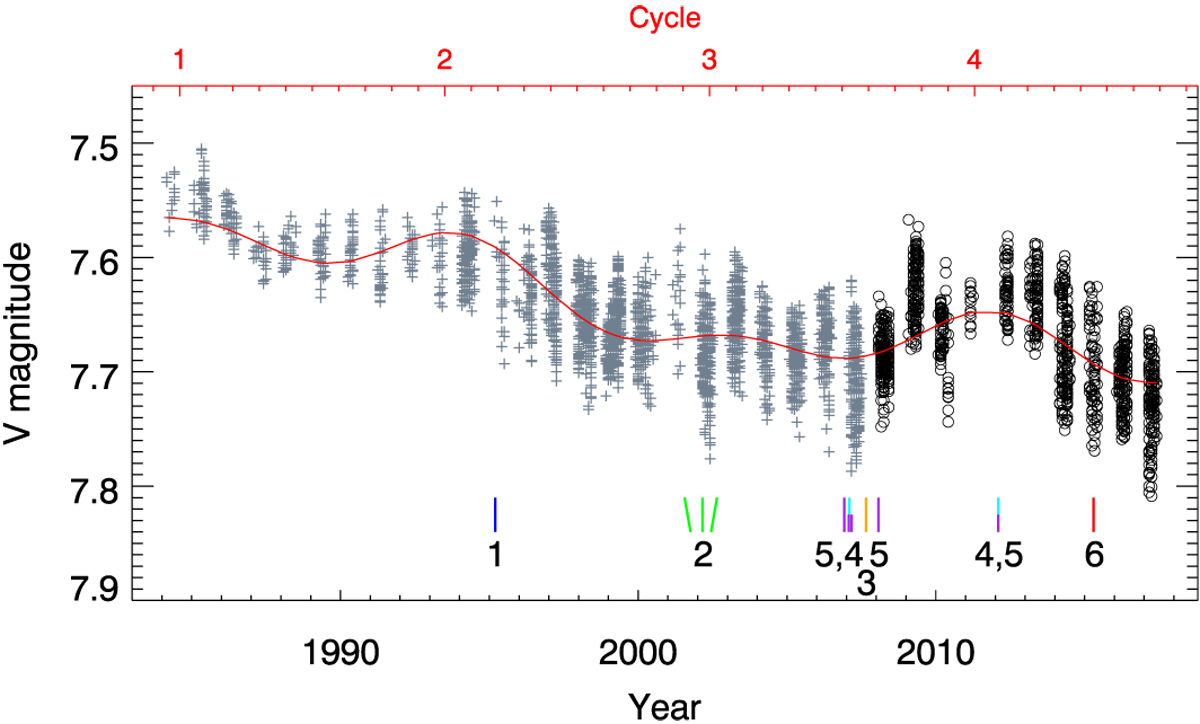
The long-term brightness record of EK Dra. The grey plus symbols denote previously published observations while the open black circles (from 2008 onward) represent new data points from this paper. The red line is the period fit to the data. The upper axis shows the cycle number/phase. The times for which there are published temperature or brightness maps are indicated with vertical ticks as follows: 1: Strassmeier & Rice (1998), 2: Järvinen et al. (2007), 3: Järvinen et al. (2009), 4: Rosén et al. (2016), 5: Waite et al. (2017), and 6: this paper.
Current usage metrics show cumulative count of Article Views (full-text article views including HTML views, PDF and ePub downloads, according to the available data) and Abstracts Views on Vision4Press platform.
Data correspond to usage on the plateform after 2015. The current usage metrics is available 48-96 hours after online publication and is updated daily on week days.
Initial download of the metrics may take a while.