Fig. 5
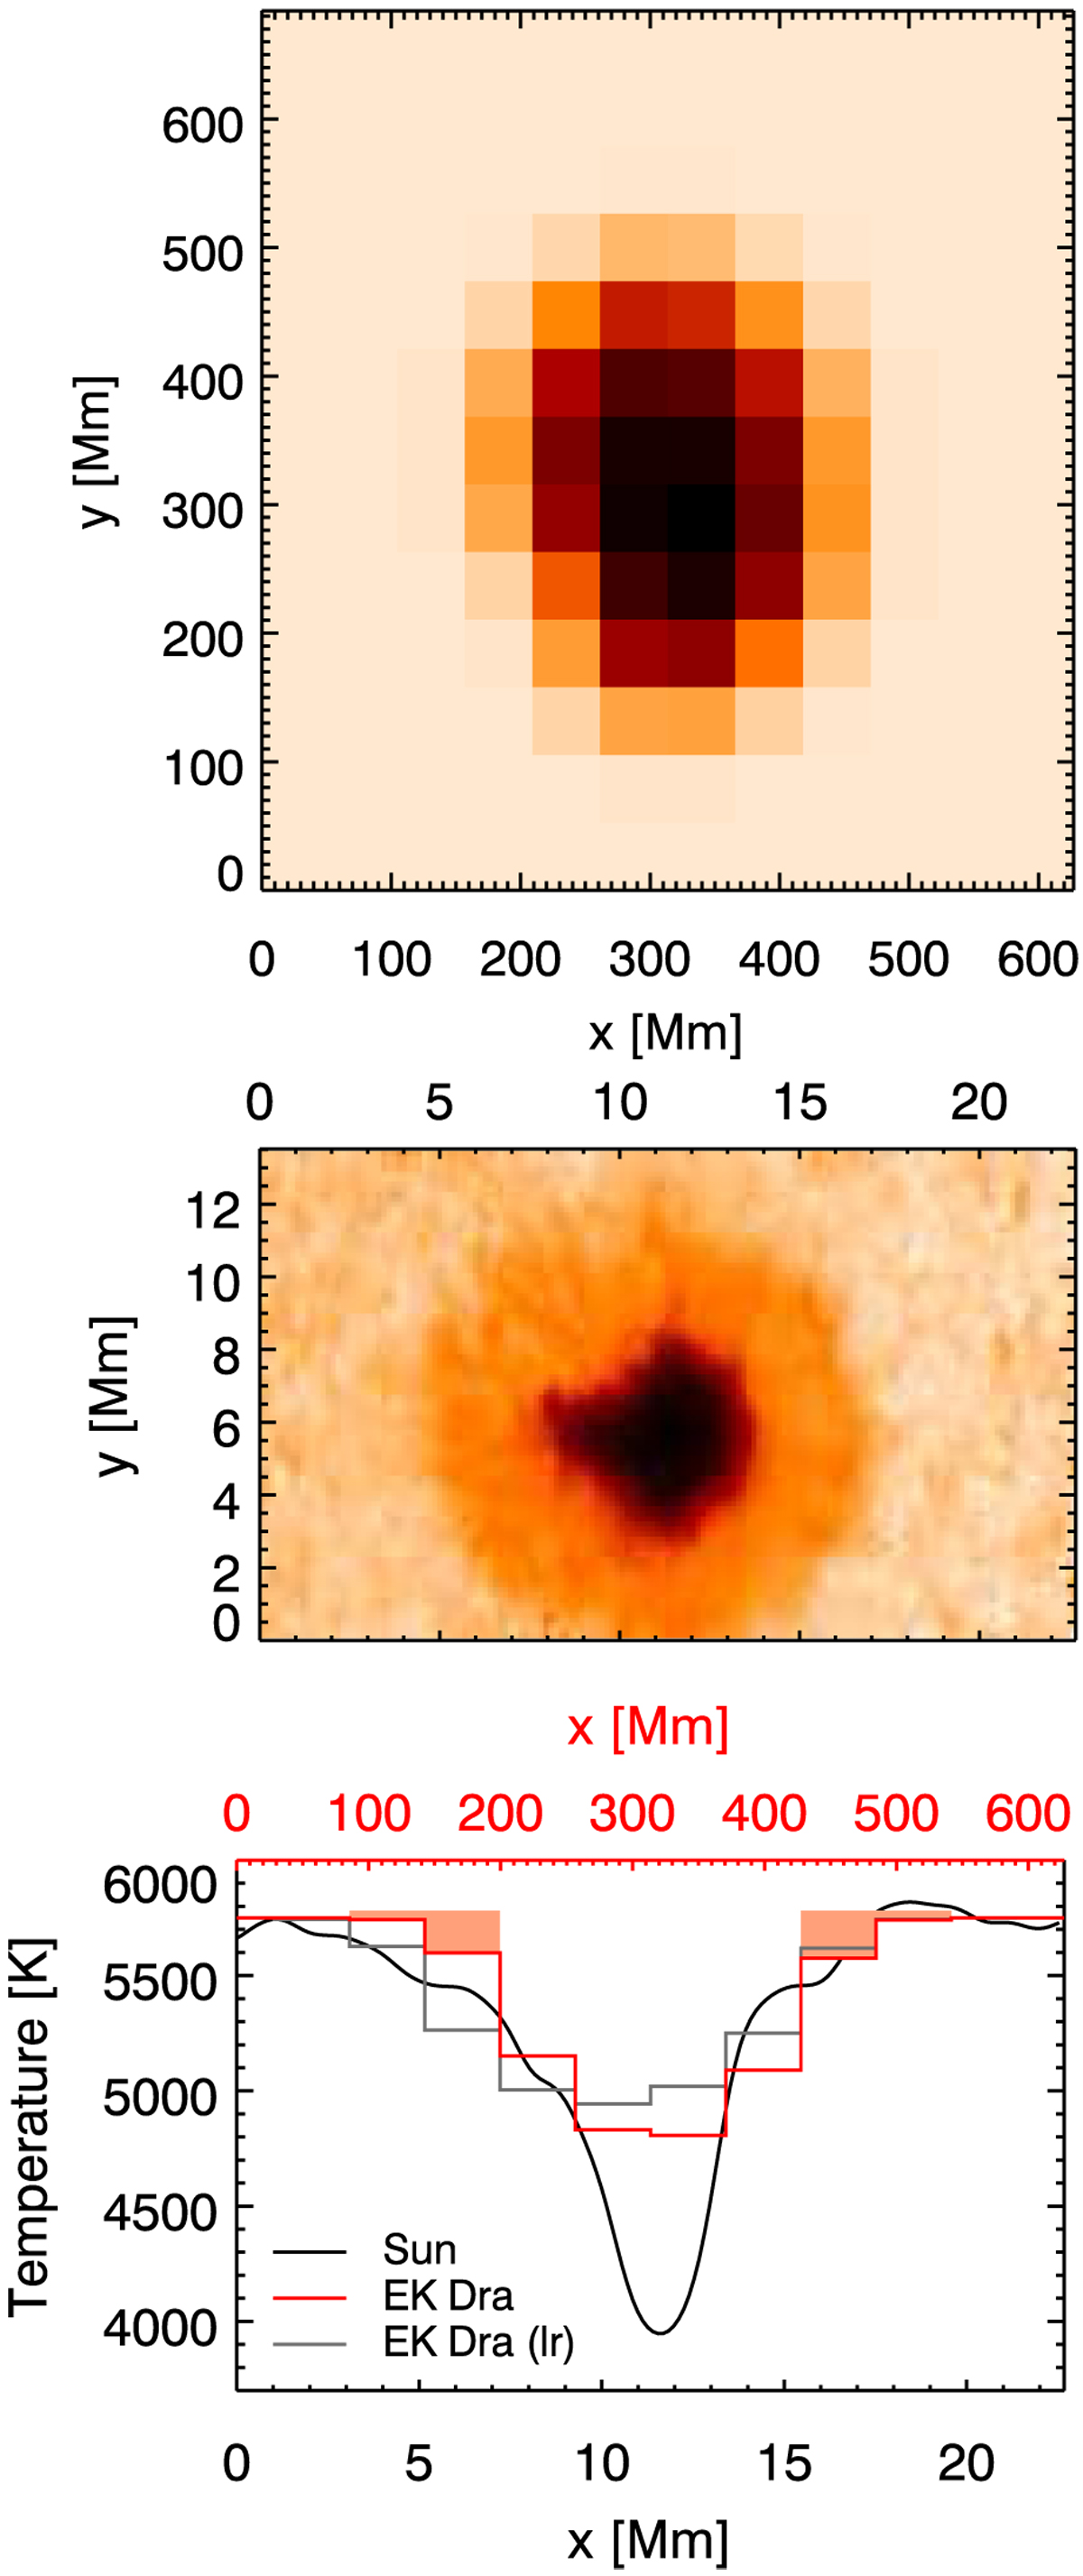
Top panel: iMap reconstruction of spot A. Pixel size is 5° both in longitudinal and in latitudinal direction. The scaling of 27:1 from surface pixels to Megameters is based on a stellar radius of 0.98R⊙. Middle panel: image of an isolated sunspot (adapted from Balthasar 2006). Bottom panel: temperature distribution of the sunspot (black line) in comparison to the mean temperature distribution of spot A of EK Dra (red histogram) and to the low-resolution (lr) result of spot A (grey) histogram). The bins belonging to the penumbra of EK Dra are indicated with light orange colour (shifted by +100 K for better visibility) while the extent of the sunspot penumbra can be directly compared with the middle panel.
Current usage metrics show cumulative count of Article Views (full-text article views including HTML views, PDF and ePub downloads, according to the available data) and Abstracts Views on Vision4Press platform.
Data correspond to usage on the plateform after 2015. The current usage metrics is available 48-96 hours after online publication and is updated daily on week days.
Initial download of the metrics may take a while.