Fig. 4
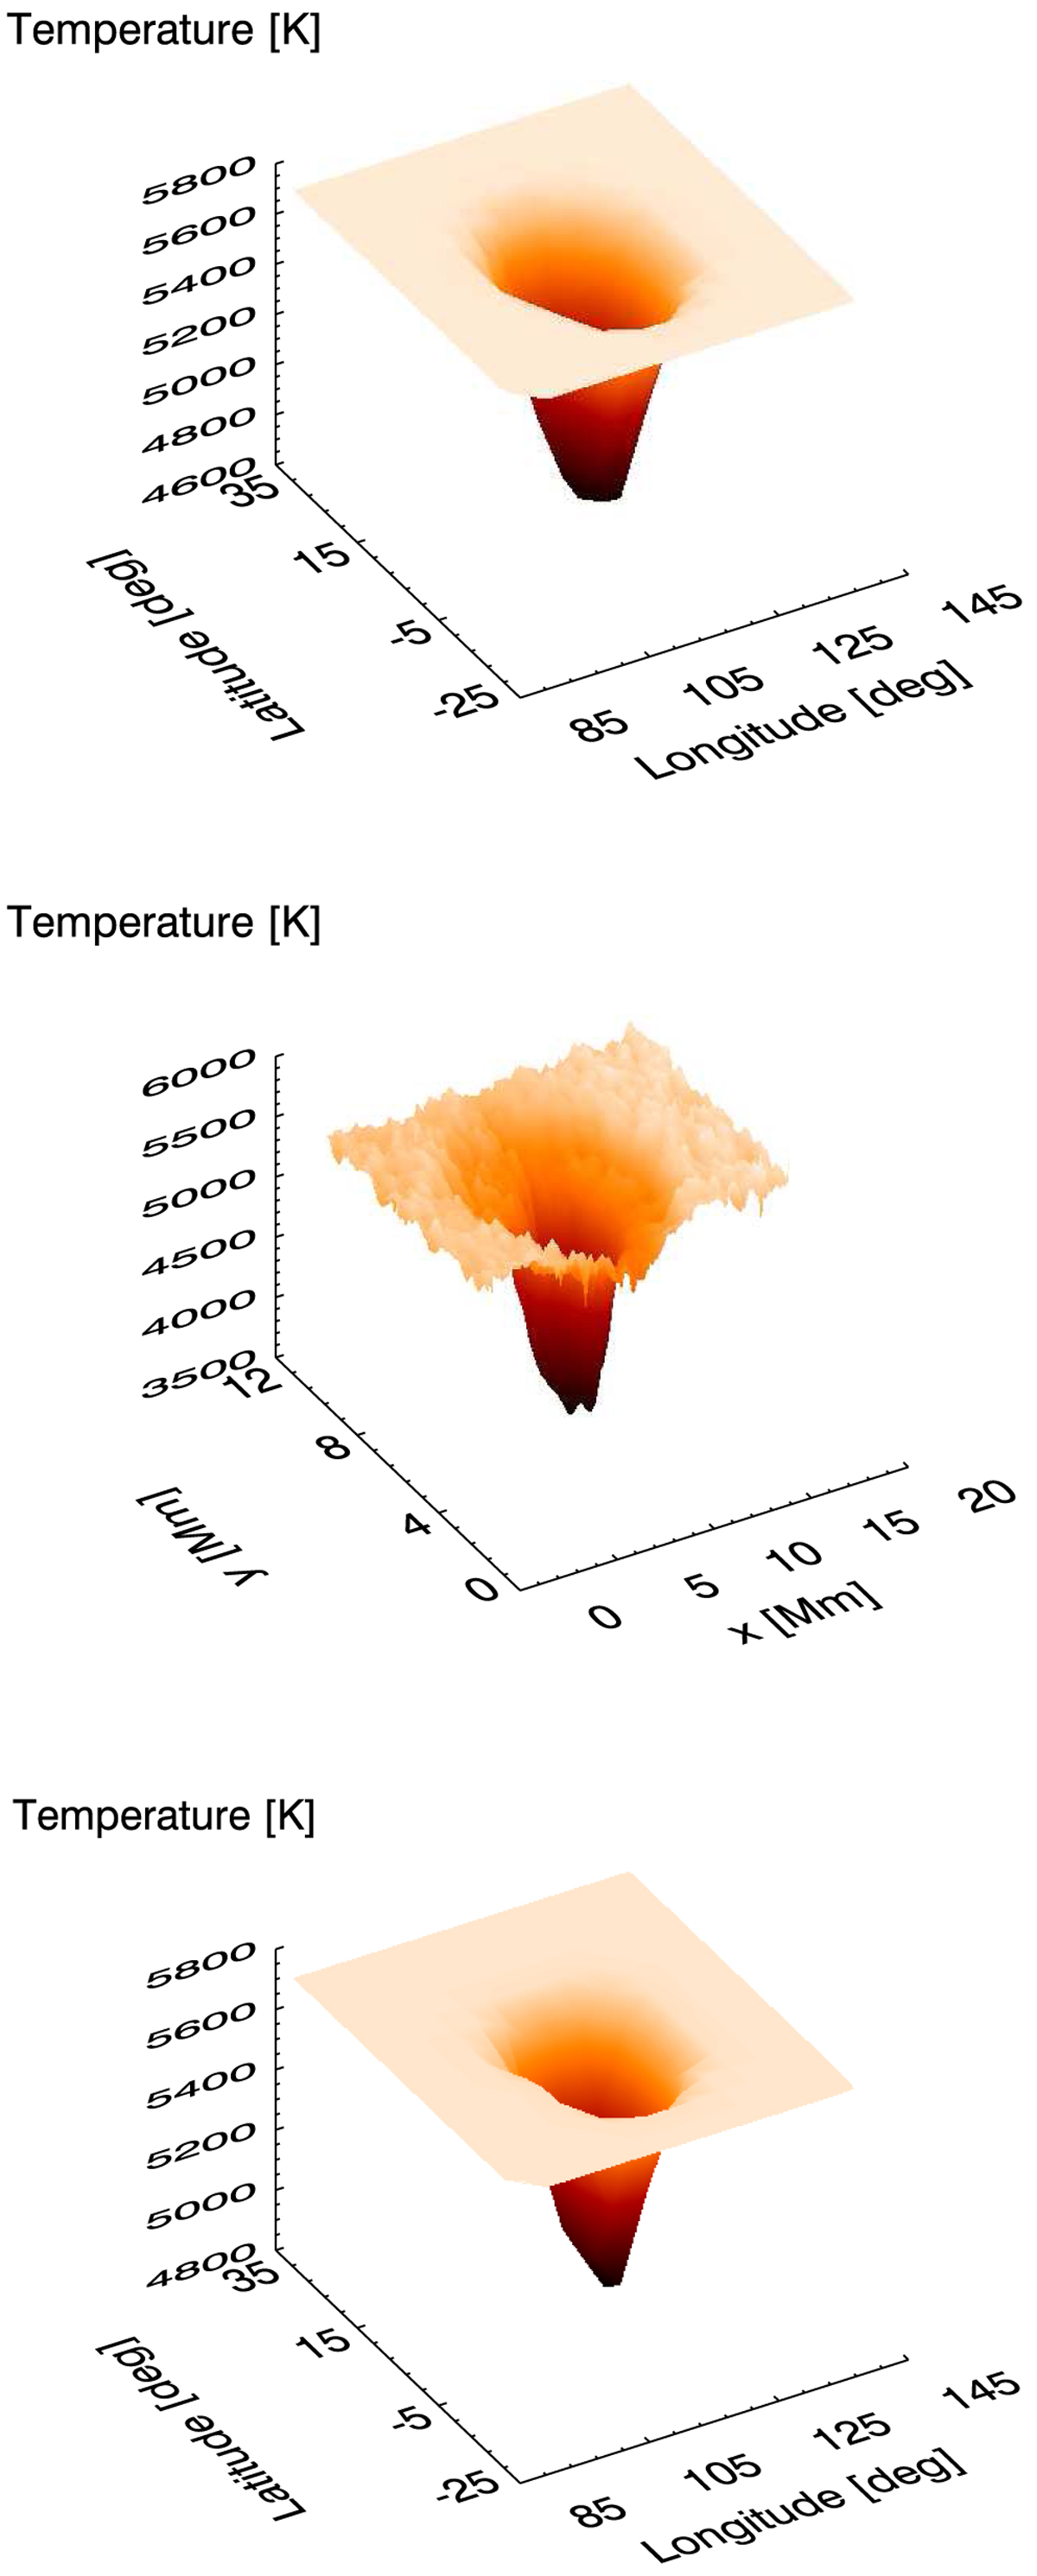
Morphology of spot A (top panel) compared to a sunspot (middle panel). Bottom panel: morphology of spot A when low-resolution data are used. The difference is the weaker umbral region. The x-axis has spot latitude, y-axis has longitude, and z-axis has the temperature elevation. The x- and y-axes of the sunspot (adapted from Balthasar 2006) are in Megameters.
Current usage metrics show cumulative count of Article Views (full-text article views including HTML views, PDF and ePub downloads, according to the available data) and Abstracts Views on Vision4Press platform.
Data correspond to usage on the plateform after 2015. The current usage metrics is available 48-96 hours after online publication and is updated daily on week days.
Initial download of the metrics may take a while.