Fig. 3
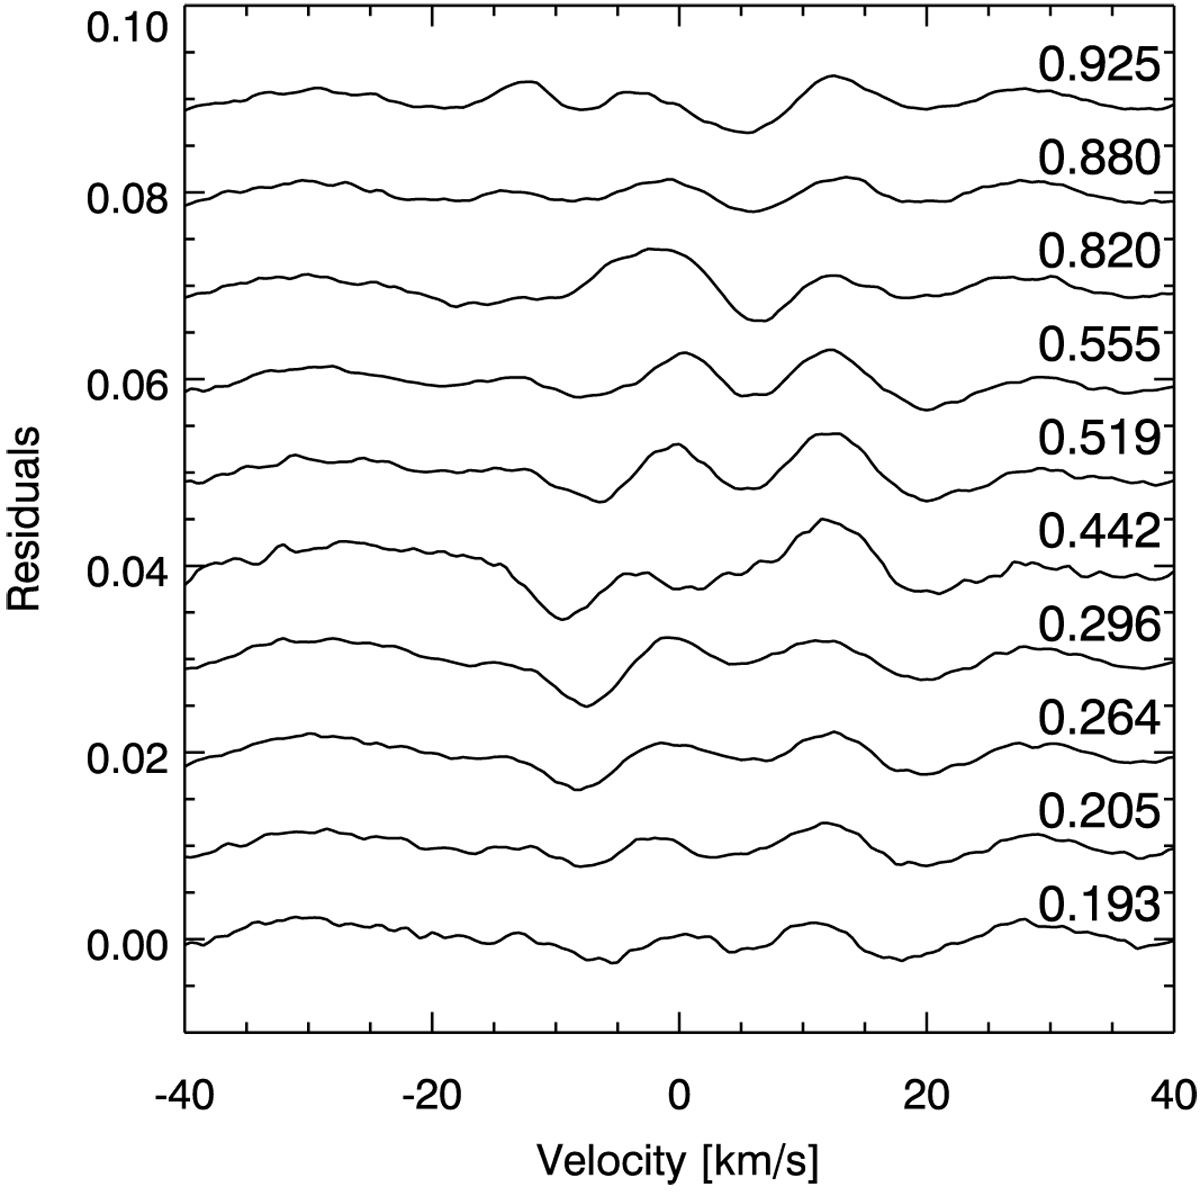
Line profile residuals (observed–inverted). As in Fig. 2, the residual profiles are labeled with their respective phases. The phase-combined rms residual is 4.2 × 10⁻⁴ but systematic deviations appear in individual profiles at ± 3 × 10⁻³. We note that the S/N of the line-averaged data is between 3500 and 10 000 and is thus in the same range as the residuals.
Current usage metrics show cumulative count of Article Views (full-text article views including HTML views, PDF and ePub downloads, according to the available data) and Abstracts Views on Vision4Press platform.
Data correspond to usage on the plateform after 2015. The current usage metrics is available 48-96 hours after online publication and is updated daily on week days.
Initial download of the metrics may take a while.