Free Access
Fig. 1
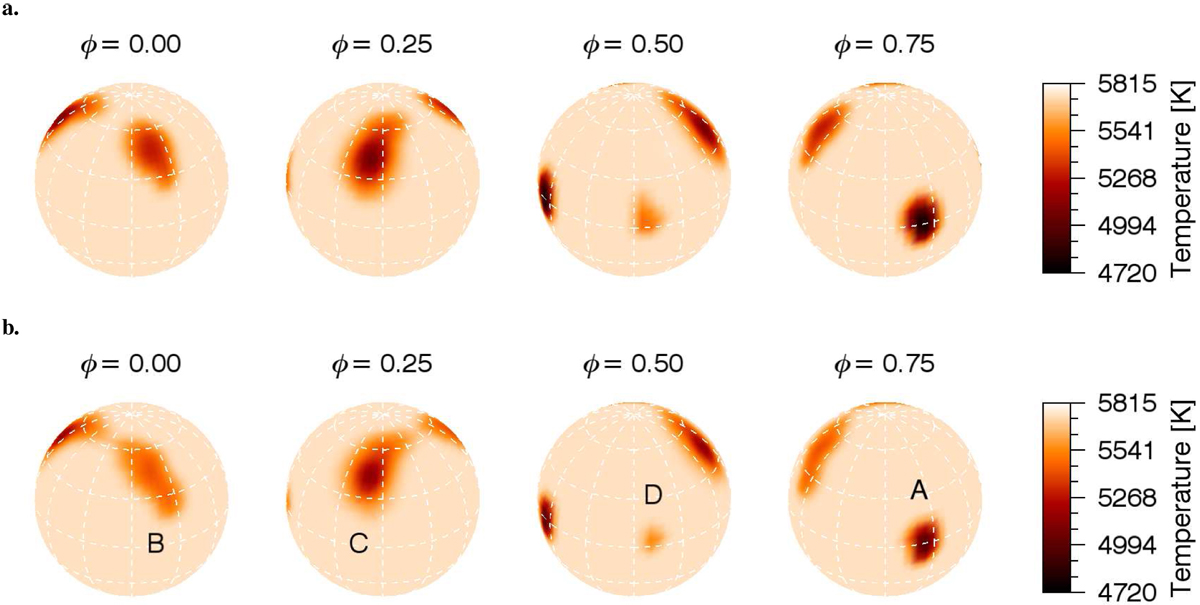
Temperature Doppler images from PEPSI observations. Panel a: based on the original data with a spectral resolution of R = 230 000 on average. Panel b: based on the same data but downgraded to a spectral resolution of 65 000. The spots are labelled A–D.
Current usage metrics show cumulative count of Article Views (full-text article views including HTML views, PDF and ePub downloads, according to the available data) and Abstracts Views on Vision4Press platform.
Data correspond to usage on the plateform after 2015. The current usage metrics is available 48-96 hours after online publication and is updated daily on week days.
Initial download of the metrics may take a while.