Fig. 5
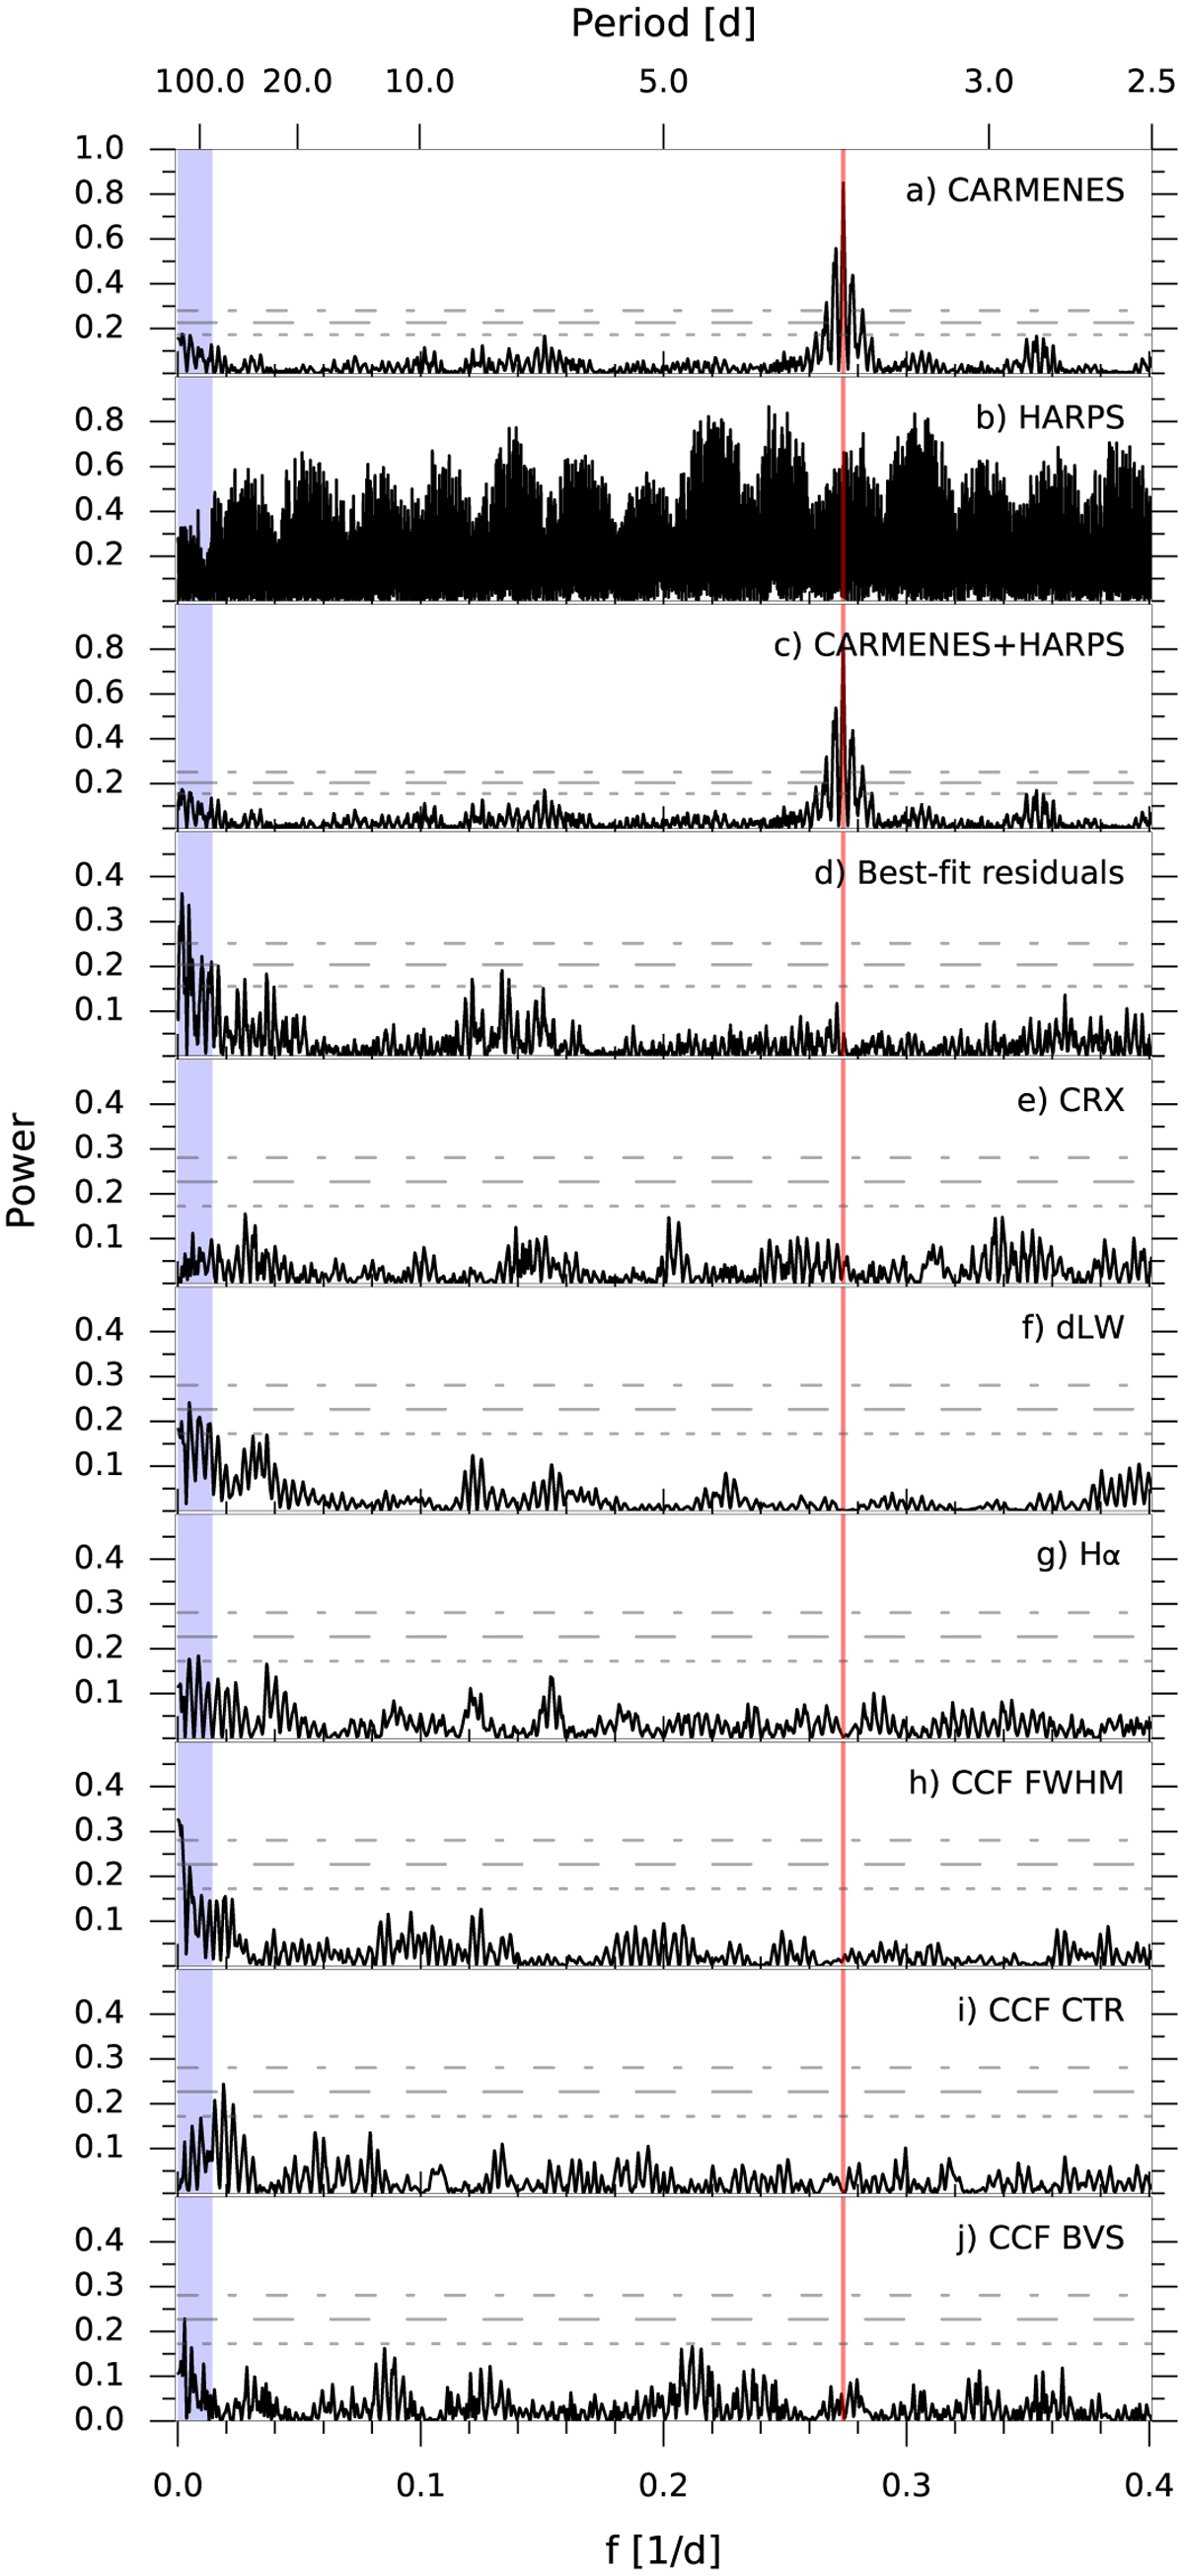
GLS periodograms for GJ 1265 CARMENES (panel a), HARPS (panel b), and combined CARMENES+HARPS (panel c) data. Panel d: residuals after removing the prominent peak at f = 0.2739 d-1 (P = 3.651 d) marked in red. The blue shaded area depicts the excluded planetary region due to stellar variability as discussed in Sect. 3. Panels e–j and horizontal lines are the same as in Fig. 2.
Current usage metrics show cumulative count of Article Views (full-text article views including HTML views, PDF and ePub downloads, according to the available data) and Abstracts Views on Vision4Press platform.
Data correspond to usage on the plateform after 2015. The current usage metrics is available 48-96 hours after online publication and is updated daily on week days.
Initial download of the metrics may take a while.