Free Access
Fig. 4
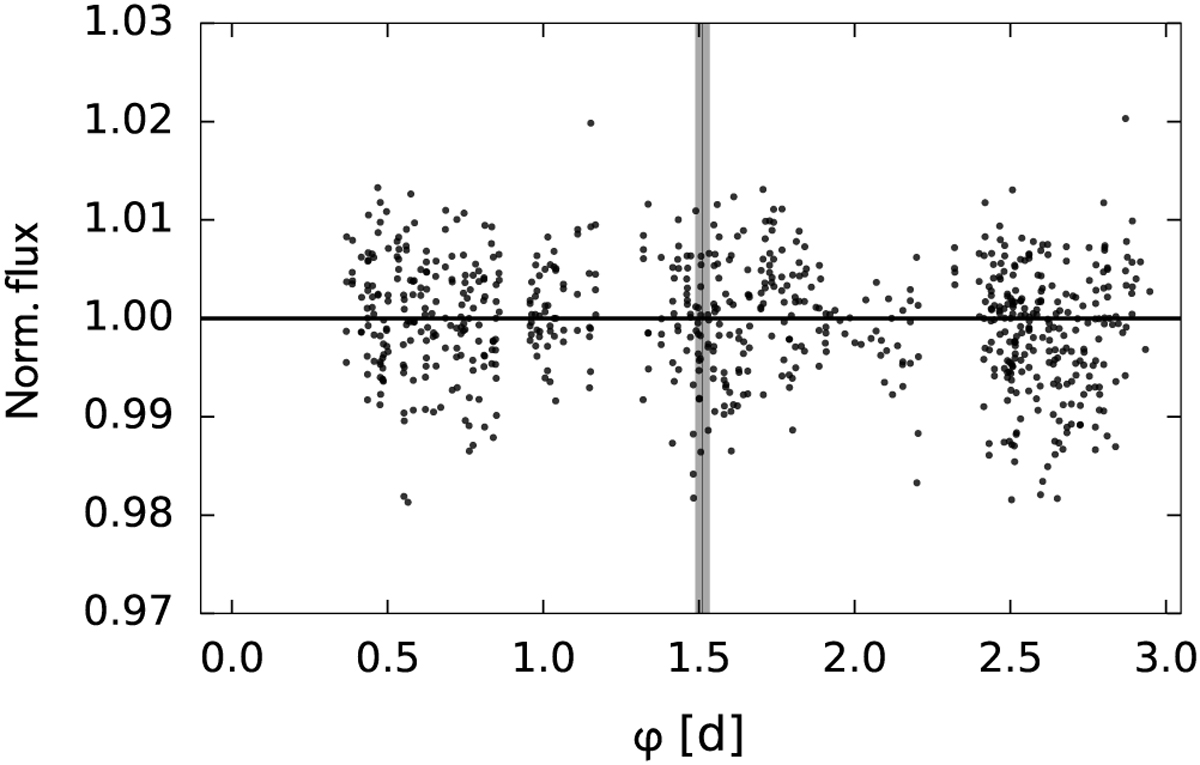
Phase-folded light curve to the 3.023 d planet period of the MEarth photometric data for GJ 3779. The grey shaded area marks the expected transit duration. The central time of the expected transit is also marked with a vertical bar.
Current usage metrics show cumulative count of Article Views (full-text article views including HTML views, PDF and ePub downloads, according to the available data) and Abstracts Views on Vision4Press platform.
Data correspond to usage on the plateform after 2015. The current usage metrics is available 48-96 hours after online publication and is updated daily on week days.
Initial download of the metrics may take a while.