Fig. 2
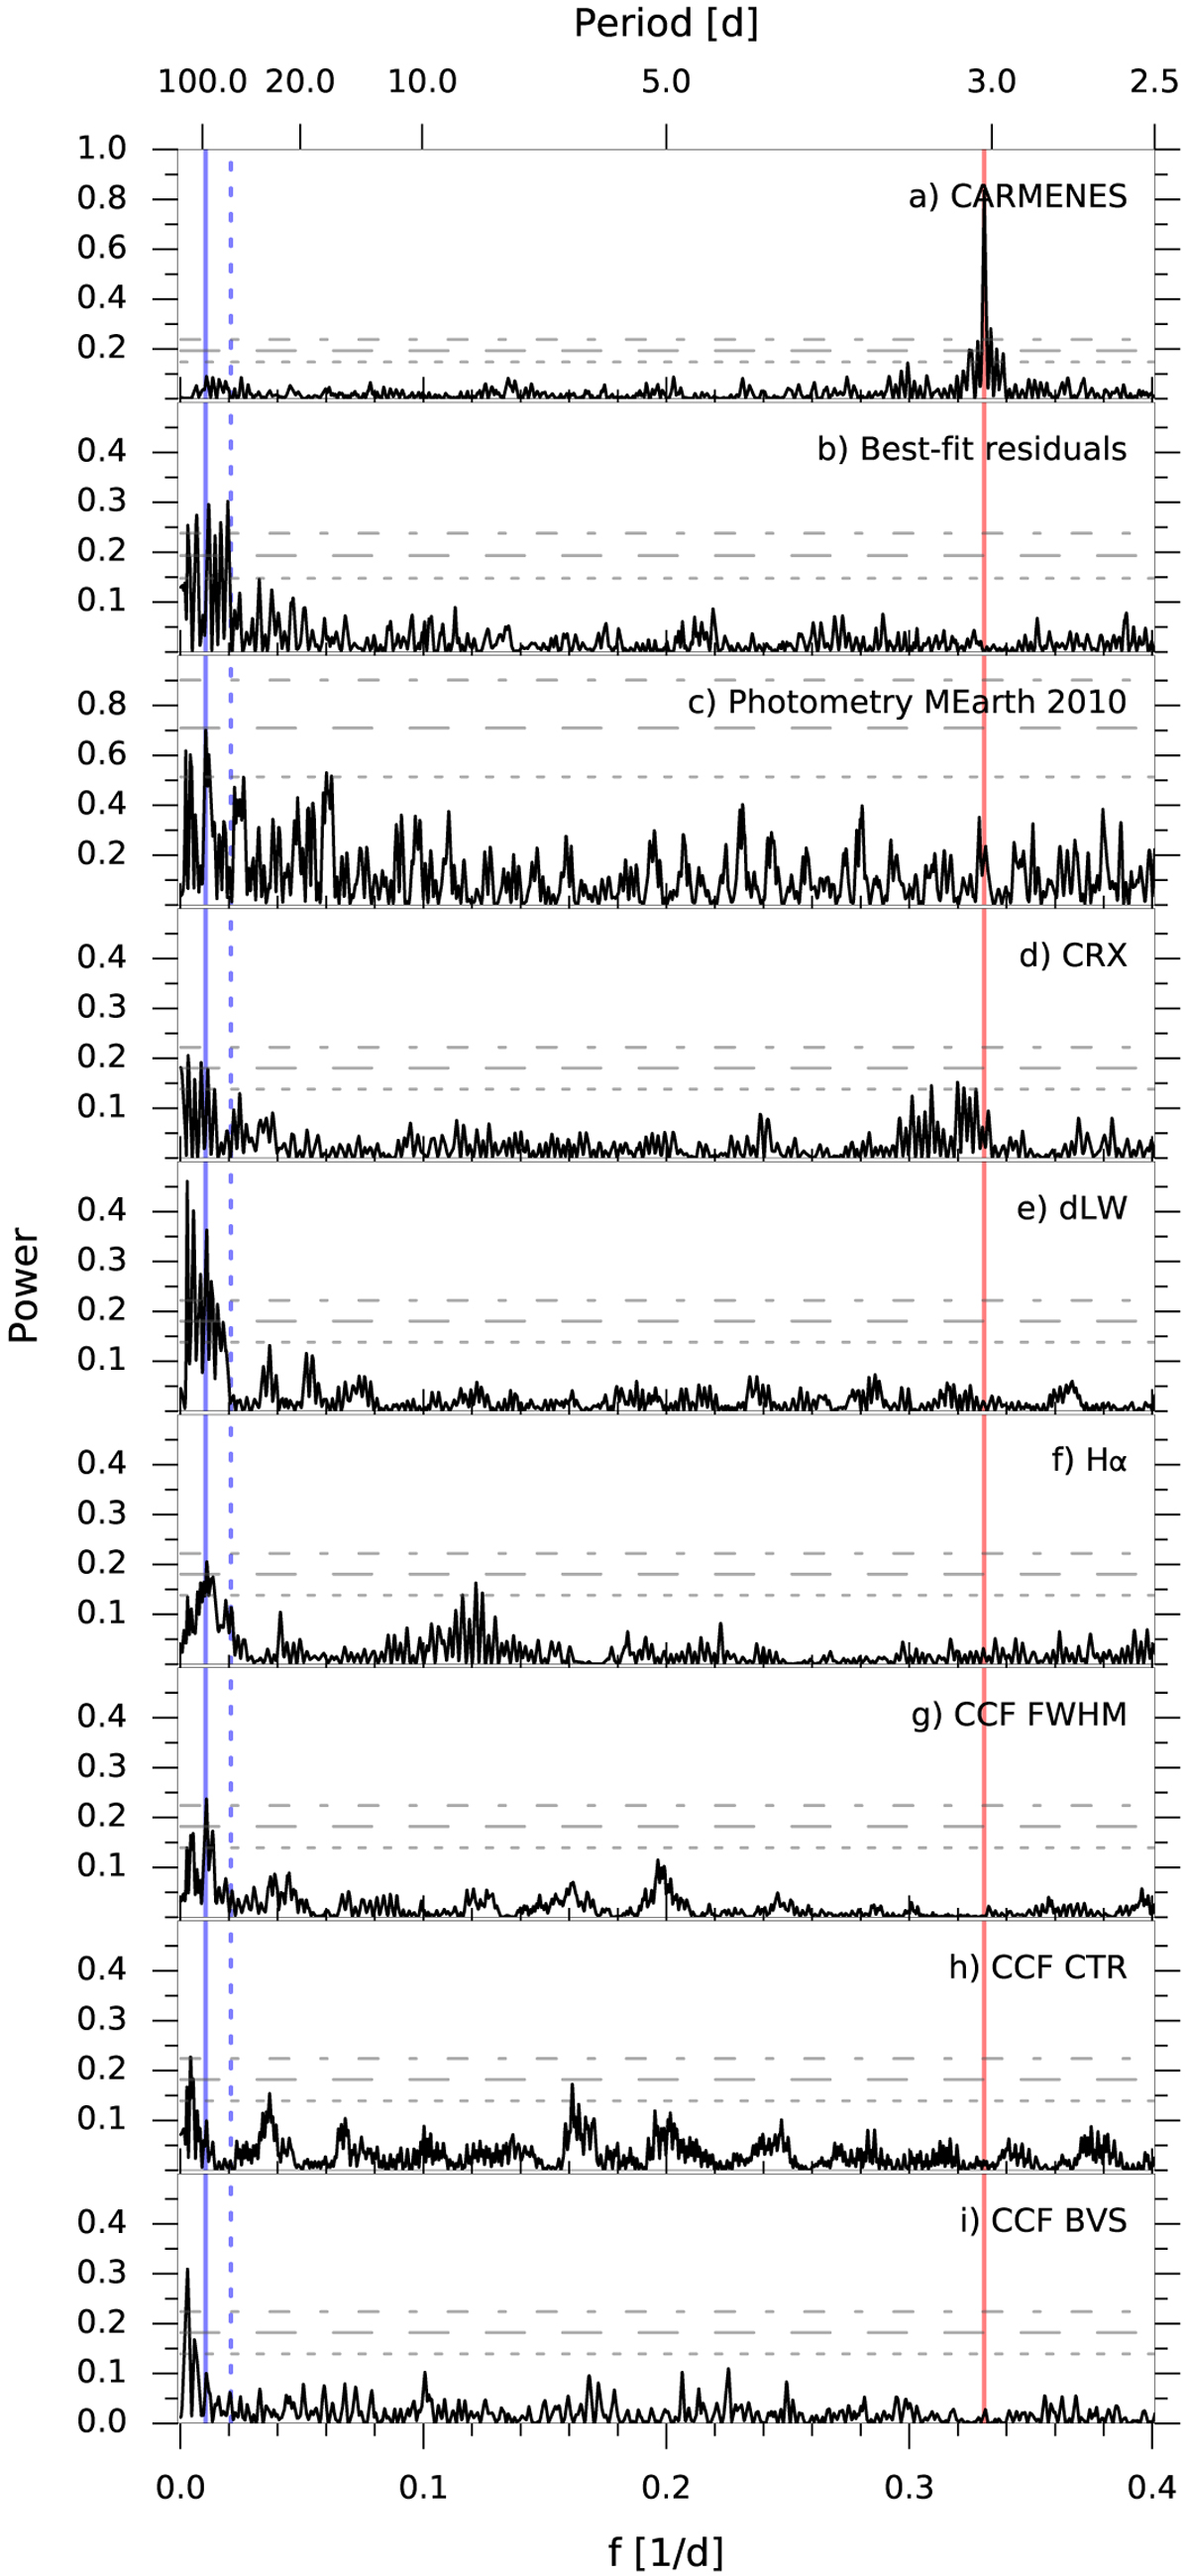
GLS periodograms for GJ 3779 CARMENES RVs (panel a) and its residuals (panel b) after removing the prominent peak at f = 0.3307 d-1 (P = 3.023 d), marked in red. Panel c: periodogram of a photometric campaign of MEarth data from 2010. The highest peak at frot = 0.0105 d-1 (P = 95.2 d) associatedwith the star’s rotation is marked with a solid blue line and its first harmonic (2frot) with a dashed blue line. Panels d–f: periodograms of the chromatic index, differential line width, and Hα index, while panels g–i show periodograms for the cross-correlation function FWHM, contrast, and bisector velocity span. Horizontal lines show the theoretical FAP levels of 10%(short-dashed line), 1% (long-dashed line), and 0.1% (dot-dashed line) for each panel.
Current usage metrics show cumulative count of Article Views (full-text article views including HTML views, PDF and ePub downloads, according to the available data) and Abstracts Views on Vision4Press platform.
Data correspond to usage on the plateform after 2015. The current usage metrics is available 48-96 hours after online publication and is updated daily on week days.
Initial download of the metrics may take a while.