Fig. C.1
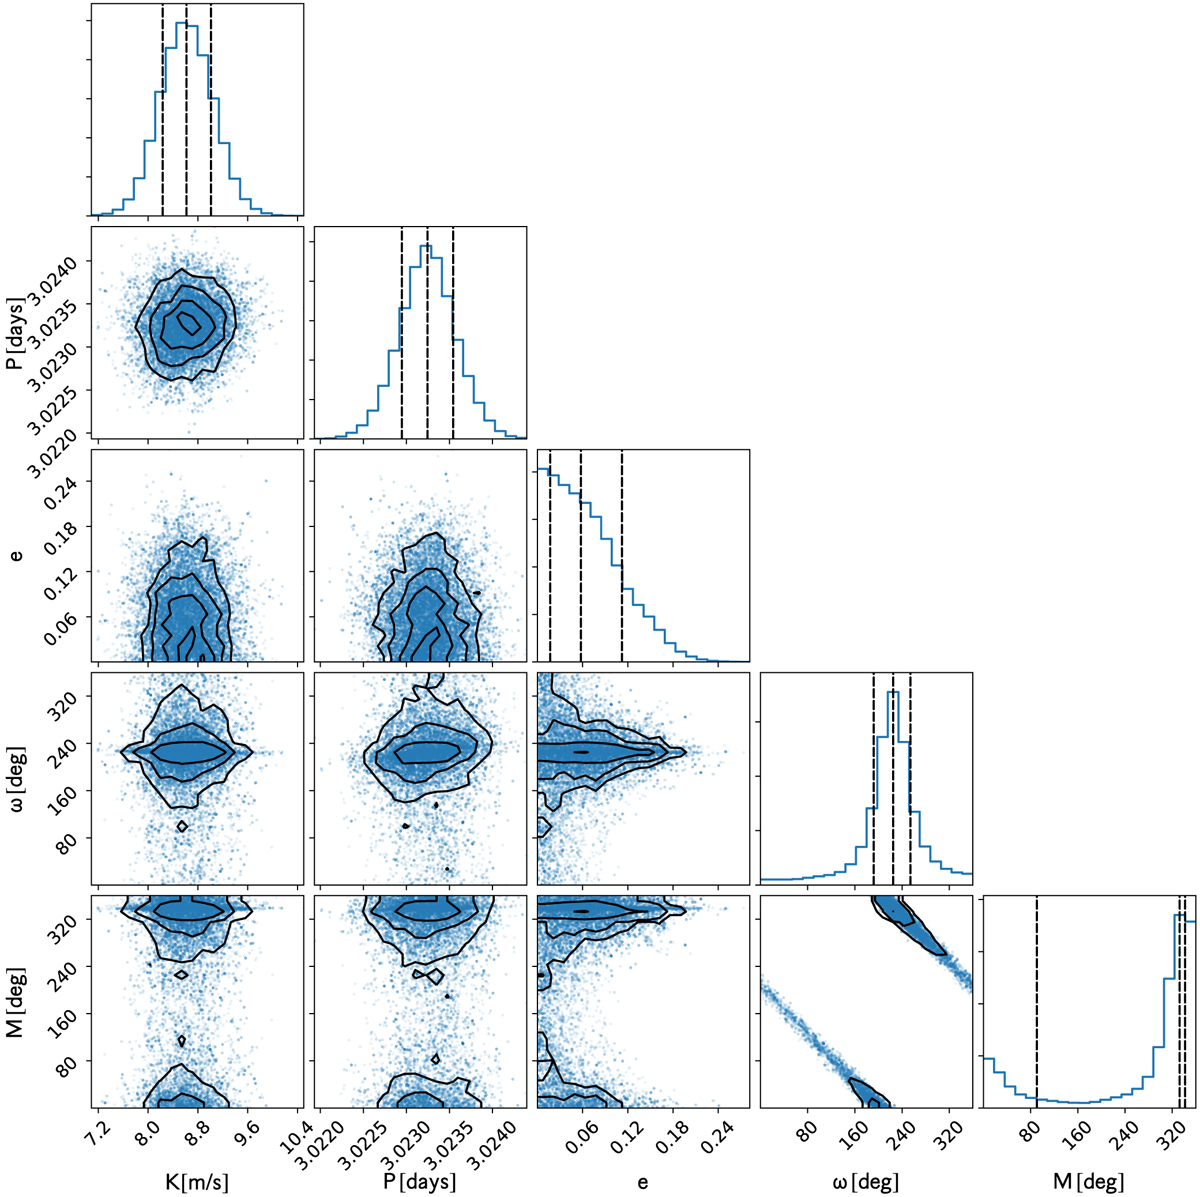
MCMC results using the CARMENES RVs obtained for GJ 3779. Each panel contains approximately 40 000 Keplerian samples. The upper panels of the corner plot show the probability density distributions of each orbital parameter. The vertical dashed lines indicate the mean and 1σ uncertainties of the fitted parameters. The rest of the panels show the dependencies between all the orbital elements in the parameter space. Black contours are drawn to improve the visualisation of the two-dimensional histograms. The distributions agree within the errors with the best-fit values from Table 2.
Current usage metrics show cumulative count of Article Views (full-text article views including HTML views, PDF and ePub downloads, according to the available data) and Abstracts Views on Vision4Press platform.
Data correspond to usage on the plateform after 2015. The current usage metrics is available 48-96 hours after online publication and is updated daily on week days.
Initial download of the metrics may take a while.