Fig. 5.
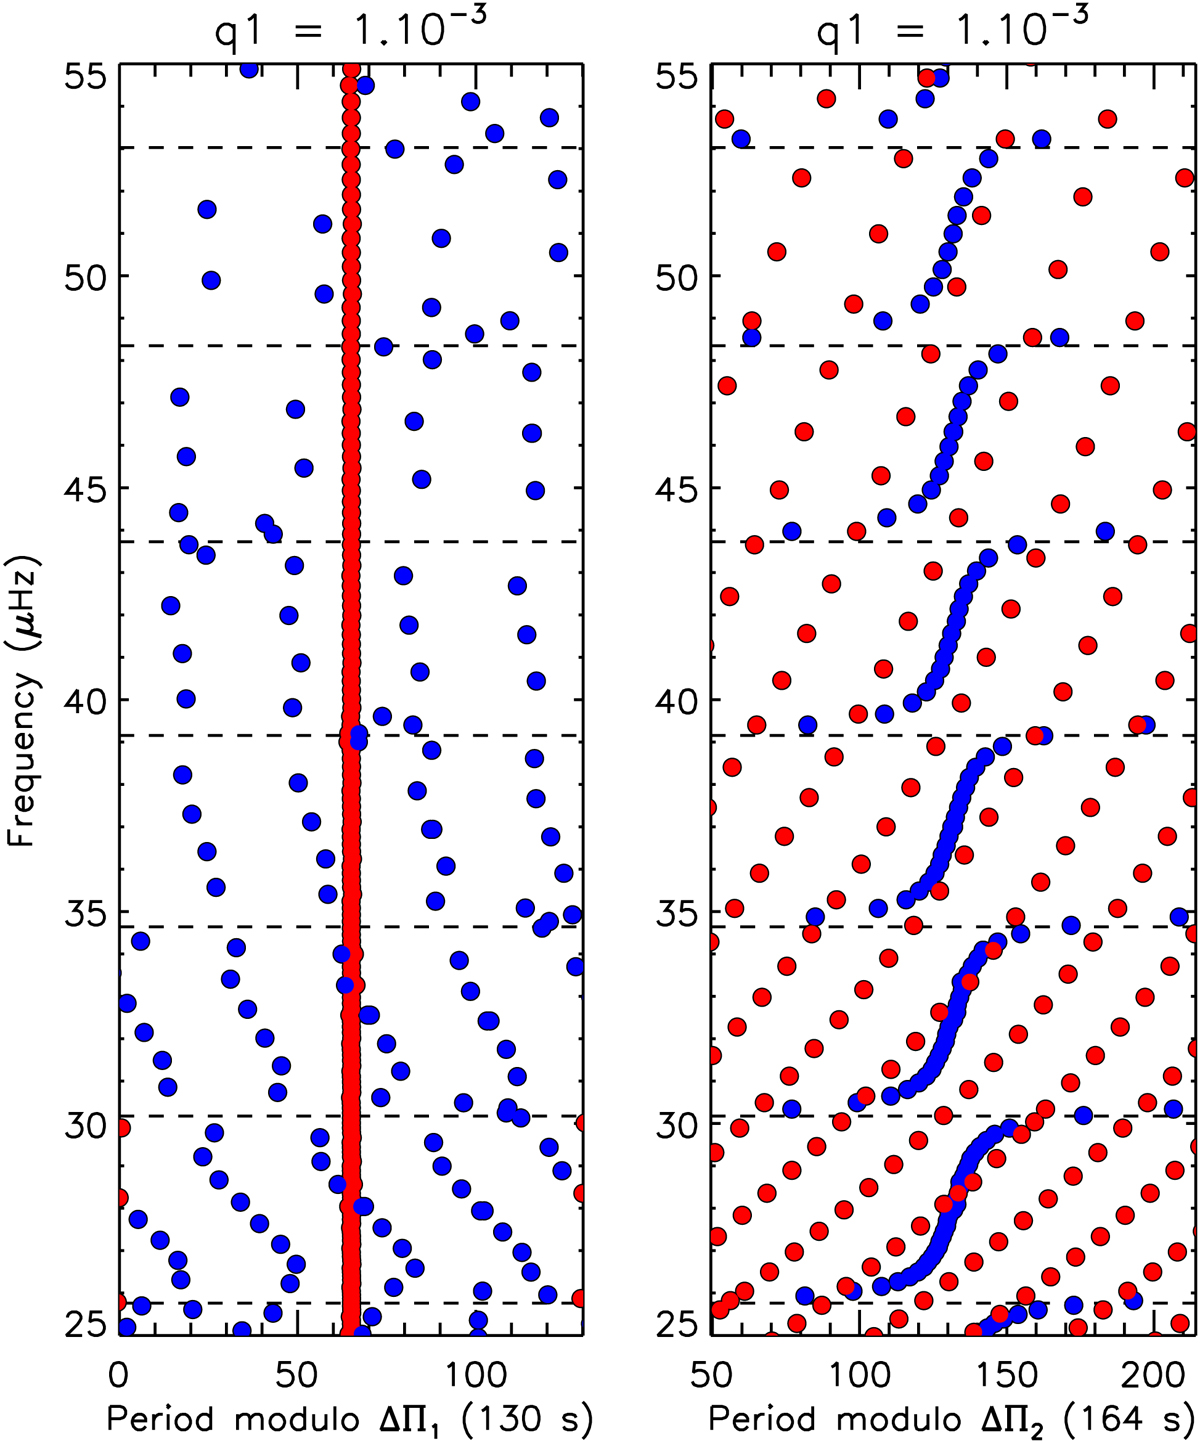
Period échelle diagrams of asymptotic oscillation modes obtained by solving Eq. (9) using the parameters given in Table 1 and considering a weak coupling between the g-mode cavities (q1 = 10−3). These diagrams were obtained by folding the mode periods using either ΔΠ1 (left panel) or ΔΠ2 (right panel). The horizontal dashed lines indicate the location of theoretical pure l = 1 p modes. Modes trapped predominantly in the g1 cavity (Ig1/I > 0.5) are filled in red, and modes trapped mainly in the g2 cavity (Ig2/I > 0.5) are filled in blue (mode trapping is estimated based on ratios of inertia, see Sect. 3.5). Other modes are left blank.
Current usage metrics show cumulative count of Article Views (full-text article views including HTML views, PDF and ePub downloads, according to the available data) and Abstracts Views on Vision4Press platform.
Data correspond to usage on the plateform after 2015. The current usage metrics is available 48-96 hours after online publication and is updated daily on week days.
Initial download of the metrics may take a while.