Fig. 3.
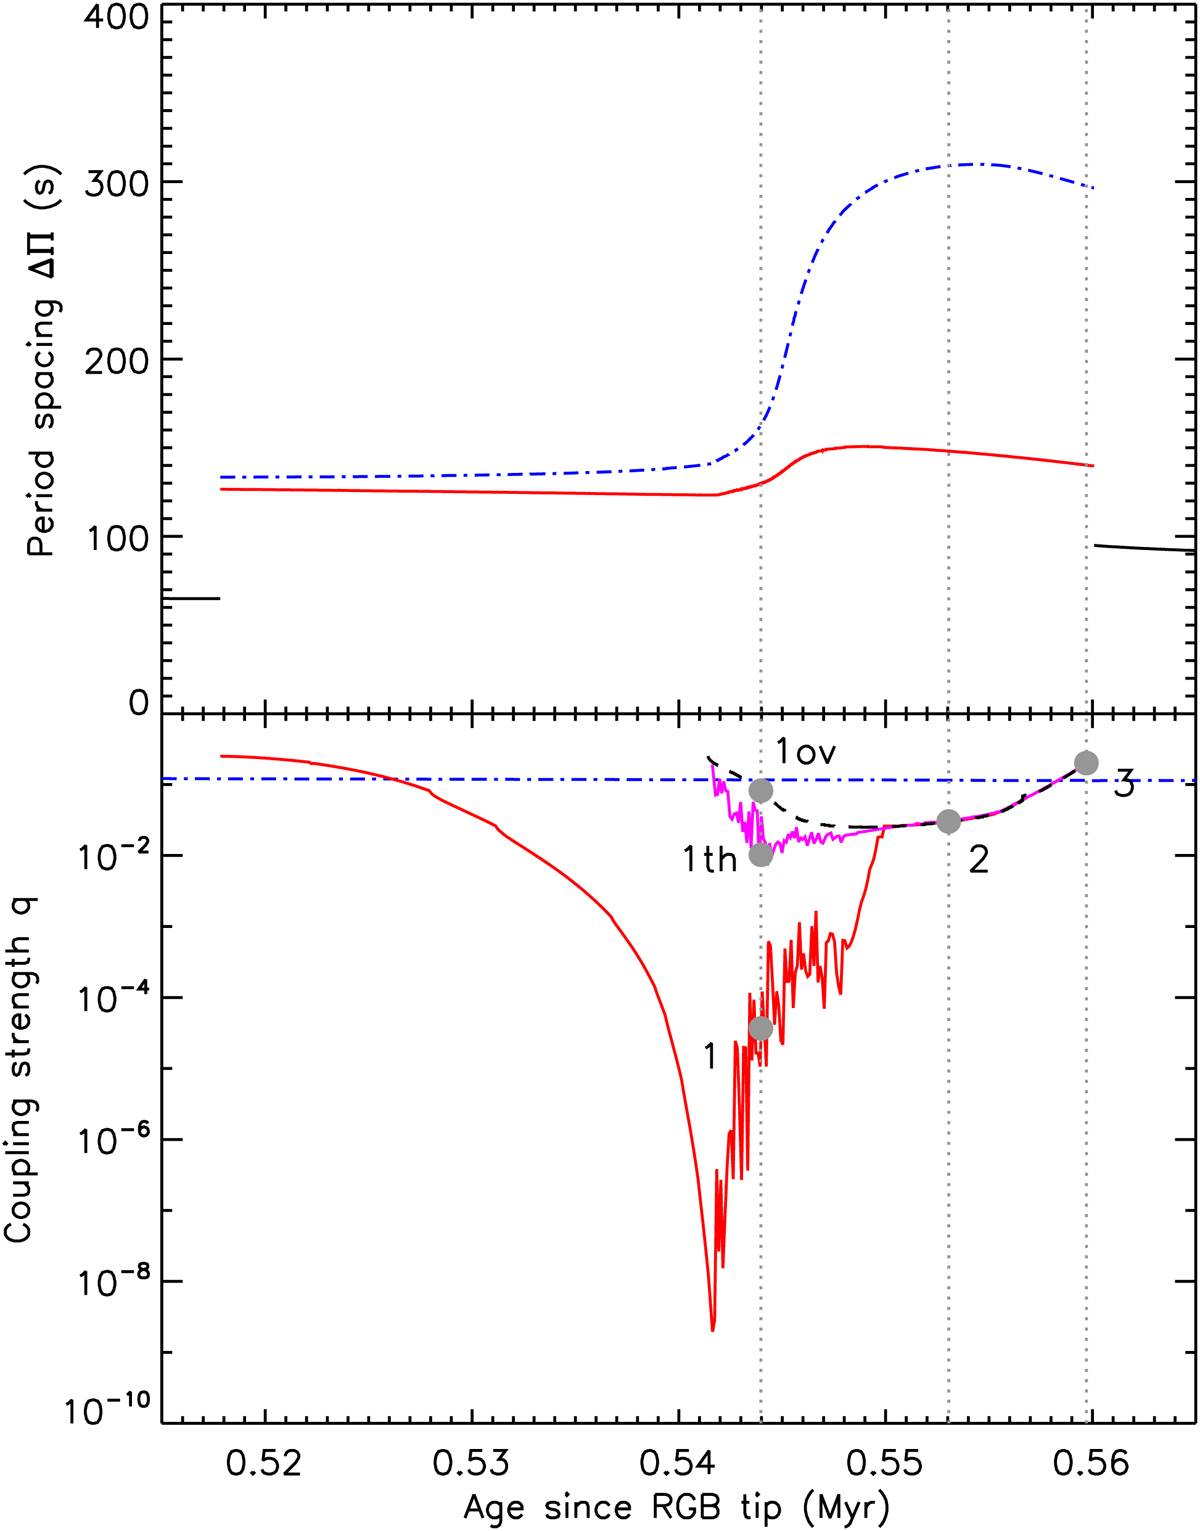
Variations in global seismic parameters during the second subflash of a 1.7 M⊙ model. The vertical gray dotted lines indicate the three evolutionary stages at which global seismic parameters are provided in Table 1. Top panel: asymptotic period spacing of dipolar modes in the g1 cavity (ΔΠ1, red solid line) and in the g2 cavity (ΔΠ2, blue dot-dashed line) as a function of time elapsed since the tip of the RGB. The black curve shows the period spacing of the single g-mode cavity outside of the He subflash. Bottom panel: variations in the coupling strength between the g1 and g2 cavities (q1, red solid line for Schwarzschild criterion, purple line for Ledoux criterion with thermohaline mixing, and black dashed line for Schwarzschild criterion with overshooting; see text for more details) and between the g2 and the p-mode cavities (q2, blue dot-dashed line).
Current usage metrics show cumulative count of Article Views (full-text article views including HTML views, PDF and ePub downloads, according to the available data) and Abstracts Views on Vision4Press platform.
Data correspond to usage on the plateform after 2015. The current usage metrics is available 48-96 hours after online publication and is updated daily on week days.
Initial download of the metrics may take a while.