Fig. 2.
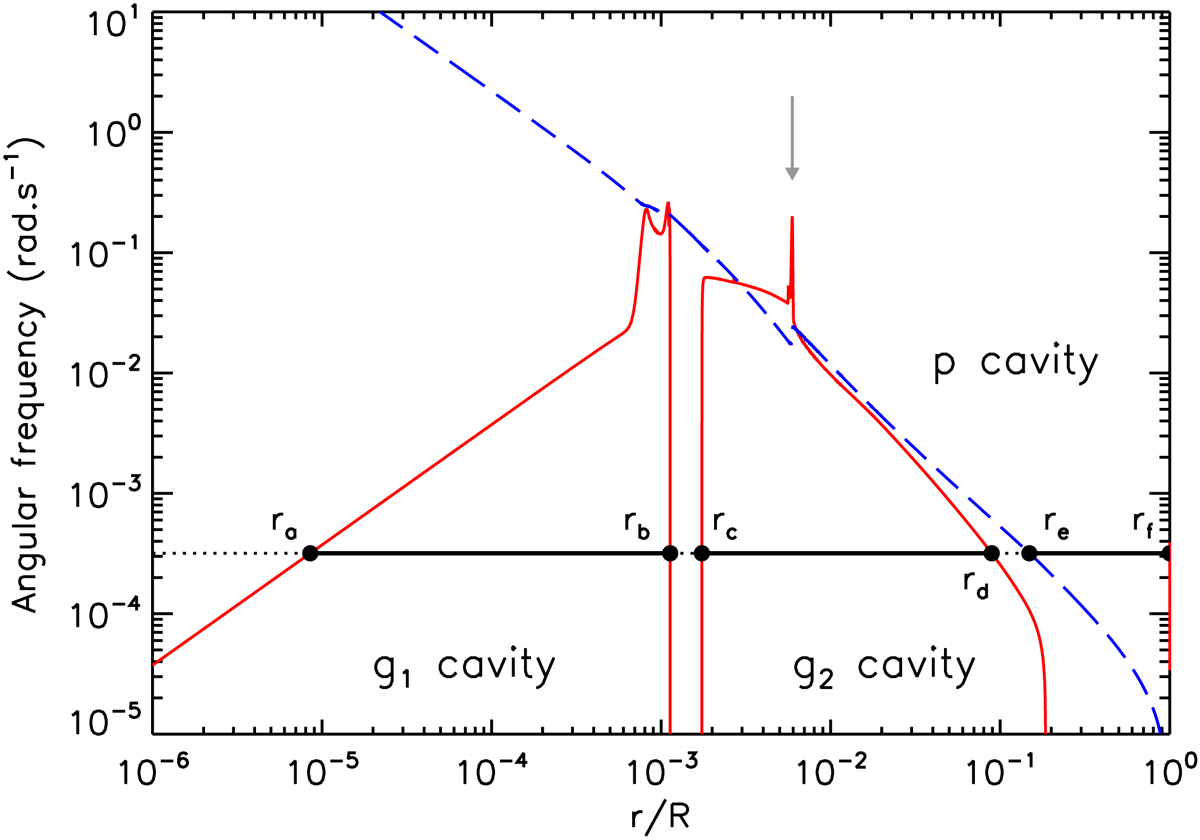
Propagation diagram for a 1.7 M⊙ model during a He-burning subflash. The Brunt–Väisälä frequency is represented by the full red curve, and the l = 1 Lamb frequency S1 corresponds to the long-dashed blue curve. The horizontal line corresponds to the angular frequency ω = 2πνmax. A wave with pulsation ω propagates where the line is solid, and it is evanescent where the line is dotted. Turning points for the cavities are also depicted by the filled circles. The gray vertical arrow indicates the position of the H-burning shell.
Current usage metrics show cumulative count of Article Views (full-text article views including HTML views, PDF and ePub downloads, according to the available data) and Abstracts Views on Vision4Press platform.
Data correspond to usage on the plateform after 2015. The current usage metrics is available 48-96 hours after online publication and is updated daily on week days.
Initial download of the metrics may take a while.