Free Access
Fig. C.1.
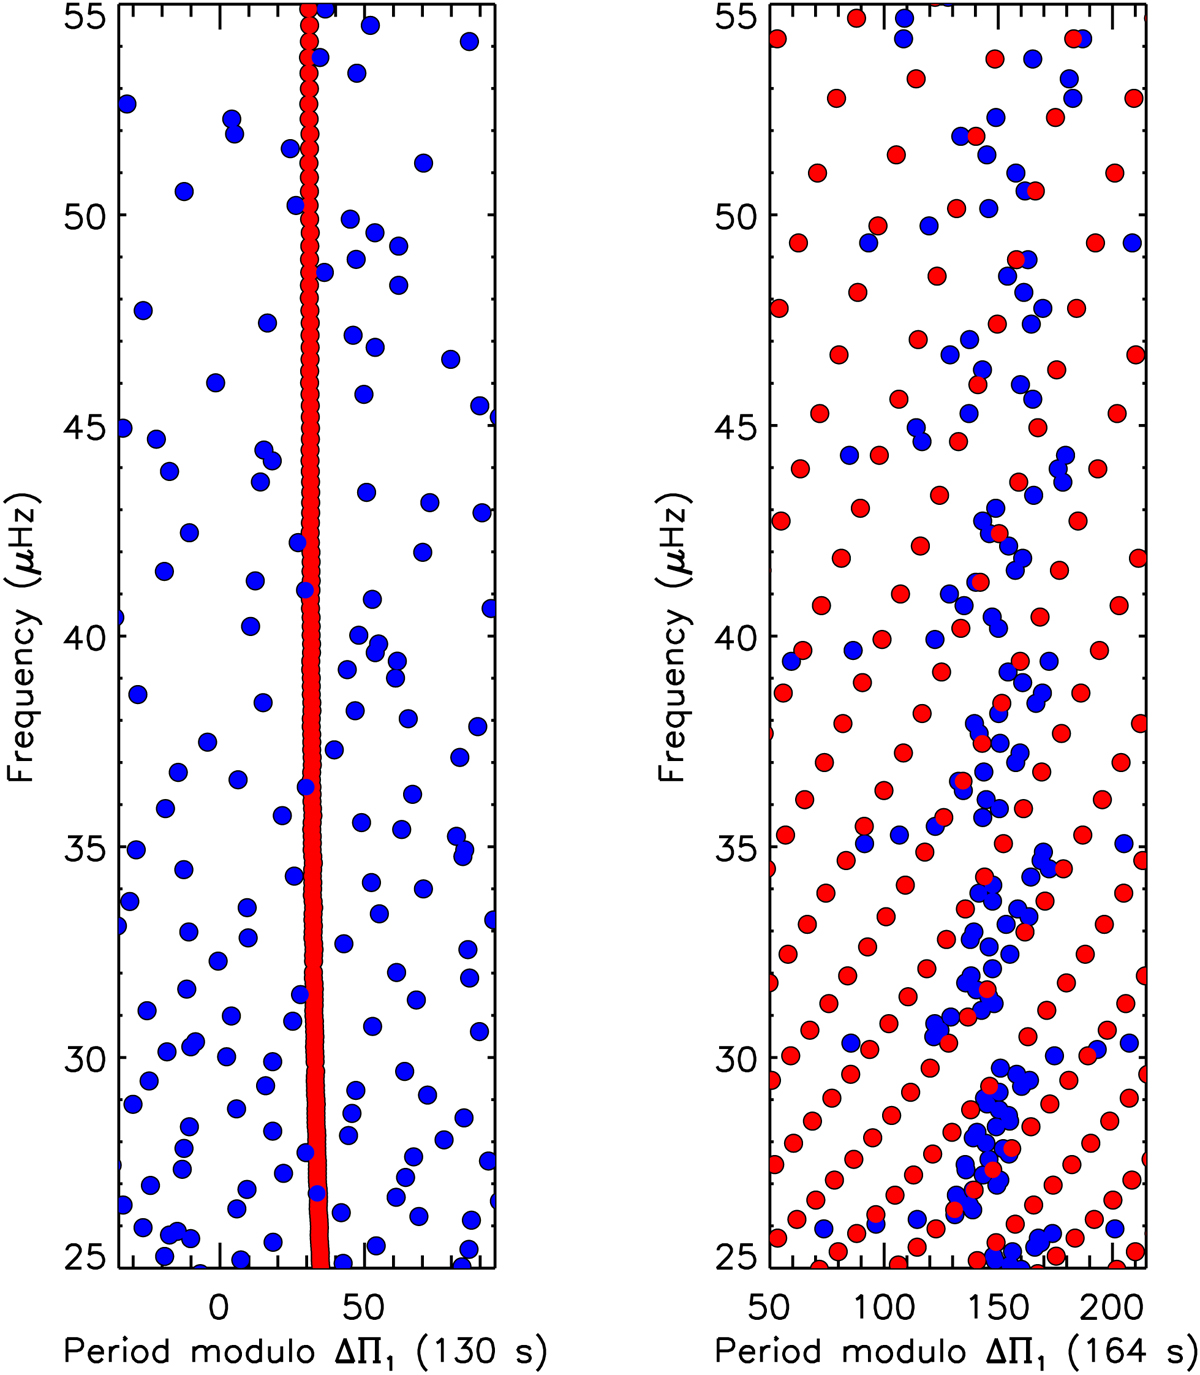
Period échelle diagrams of model 1 using oscillation modes computed with the code GYRE. These diagrams were obtained by folding the mode periods using alternately ΔΠ1 (left panel) and ΔΠ2 (right panel). Mode that have more the 50% of the energy in the g1-cavity (resp. g2-cavity) are shown as filled red (resp. blue) circles.
Current usage metrics show cumulative count of Article Views (full-text article views including HTML views, PDF and ePub downloads, according to the available data) and Abstracts Views on Vision4Press platform.
Data correspond to usage on the plateform after 2015. The current usage metrics is available 48-96 hours after online publication and is updated daily on week days.
Initial download of the metrics may take a while.