Fig. 17.
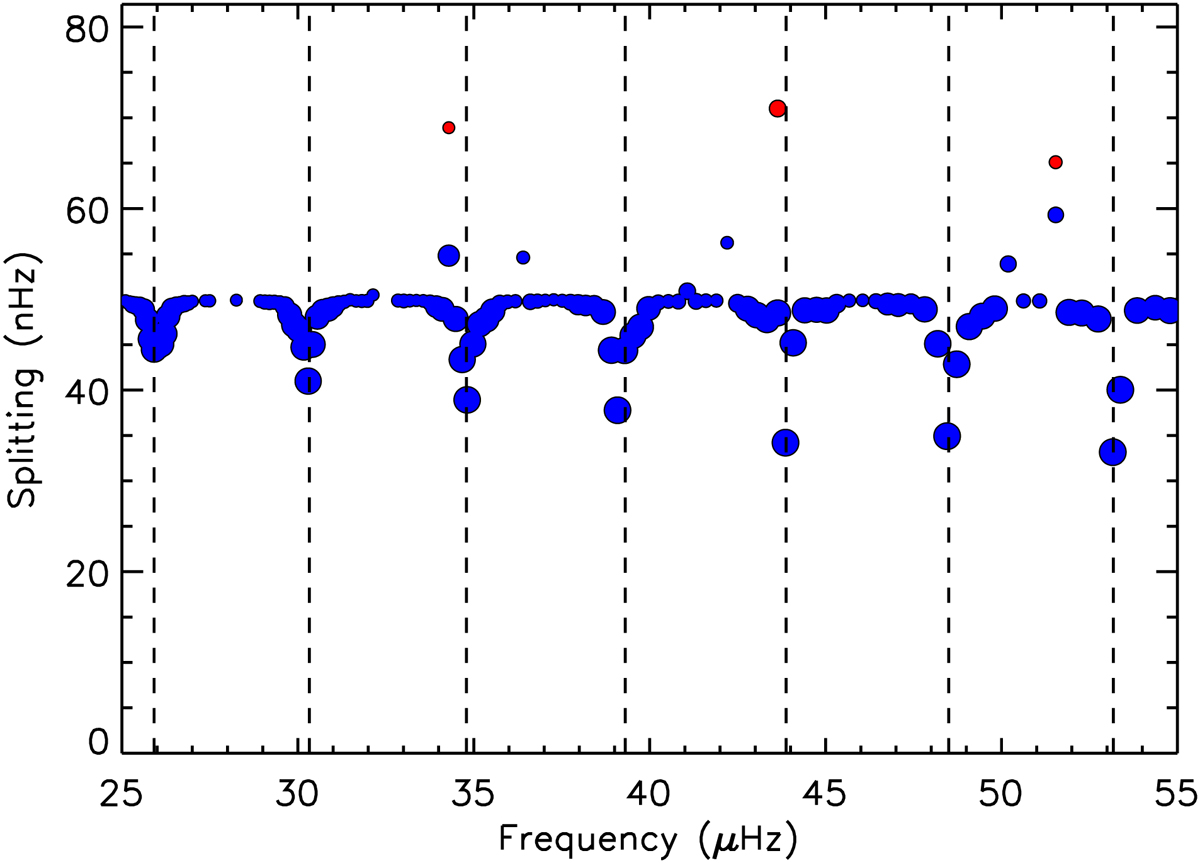
Rotational splittings obtained for model 1ov, assuming a piecewise-constant rotation profile with Ωg1 = 150 nHz, Ωg2 = 100 nHz, and Ωp = 10 nHz (see text). Modes that are trapped mainly in the g1 and g2 cavities are shown as red and blue filled circles, respectively. The size of the circles indicates the expected height of each mode in the observed spectrum. Only the modes with a height corresponding to at least 10% of the height of a pure p mode are shown. The vertical dashed lines indicate the location of theoretical pure p modes.
Current usage metrics show cumulative count of Article Views (full-text article views including HTML views, PDF and ePub downloads, according to the available data) and Abstracts Views on Vision4Press platform.
Data correspond to usage on the plateform after 2015. The current usage metrics is available 48-96 hours after online publication and is updated daily on week days.
Initial download of the metrics may take a while.