Fig. 14.
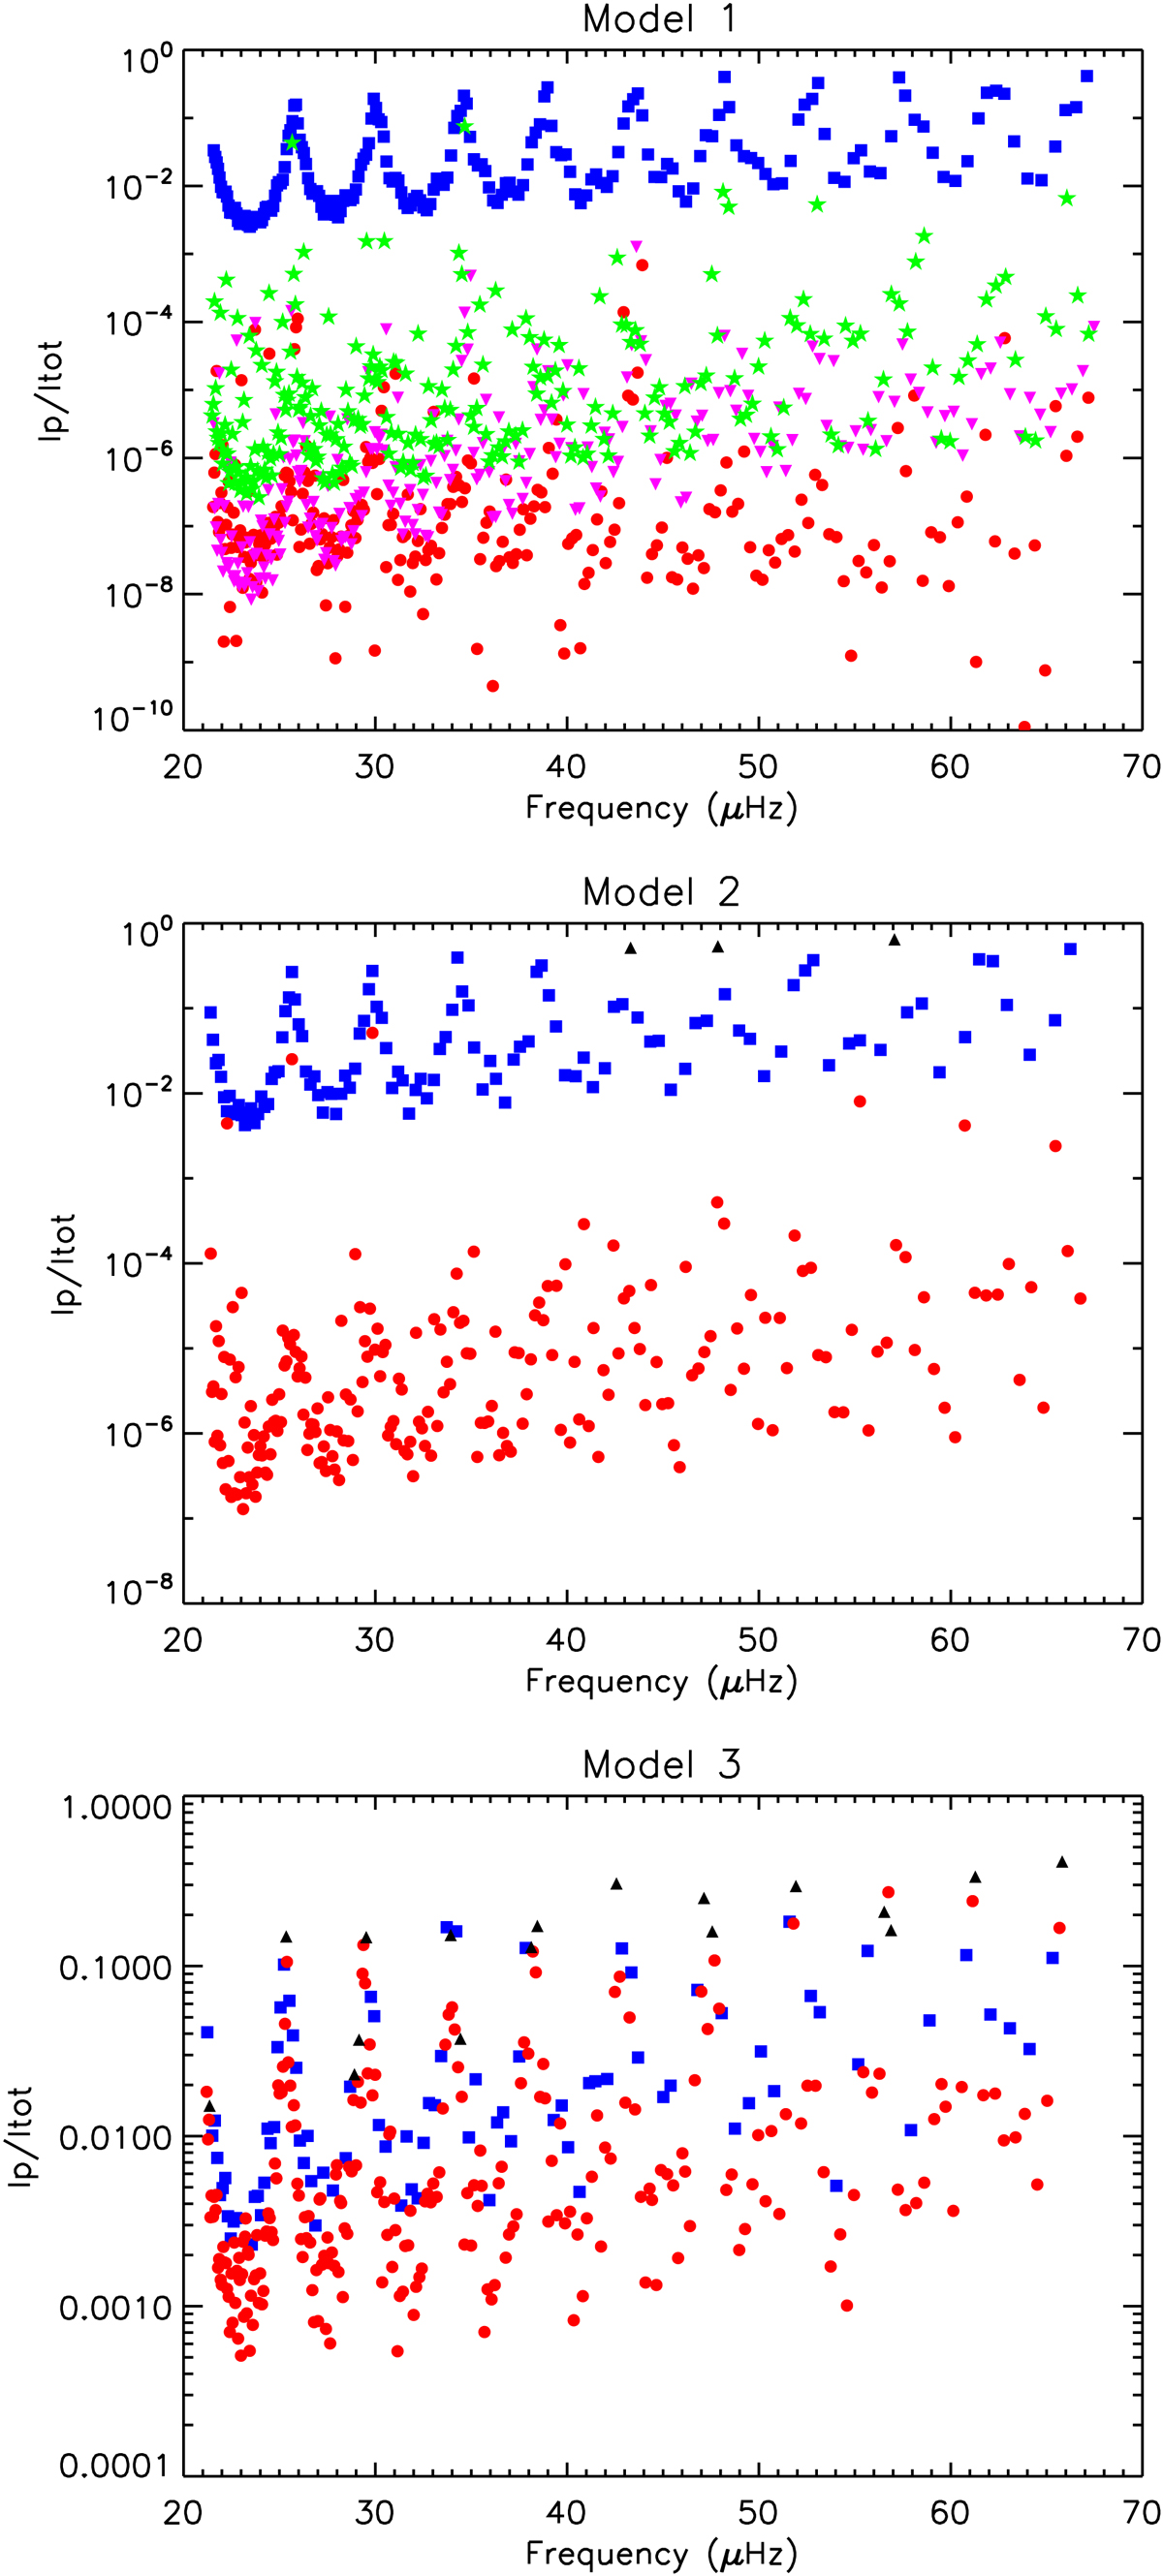
Fractional contribution of the acoustic cavity to the mode inertia for models 1, 2, and 3. Modes that have more than half of their energy trapped in the g1 (resp. g2) cavity are shown as filled red circles (resp. blue squares). Other modes are shown as filled black triangles. In the top panel, we also show Ip/I for the g1-dominated modes of models 1th (purple downward triangles) and 1ov (green stars).
Current usage metrics show cumulative count of Article Views (full-text article views including HTML views, PDF and ePub downloads, according to the available data) and Abstracts Views on Vision4Press platform.
Data correspond to usage on the plateform after 2015. The current usage metrics is available 48-96 hours after online publication and is updated daily on week days.
Initial download of the metrics may take a while.