Fig. 12.
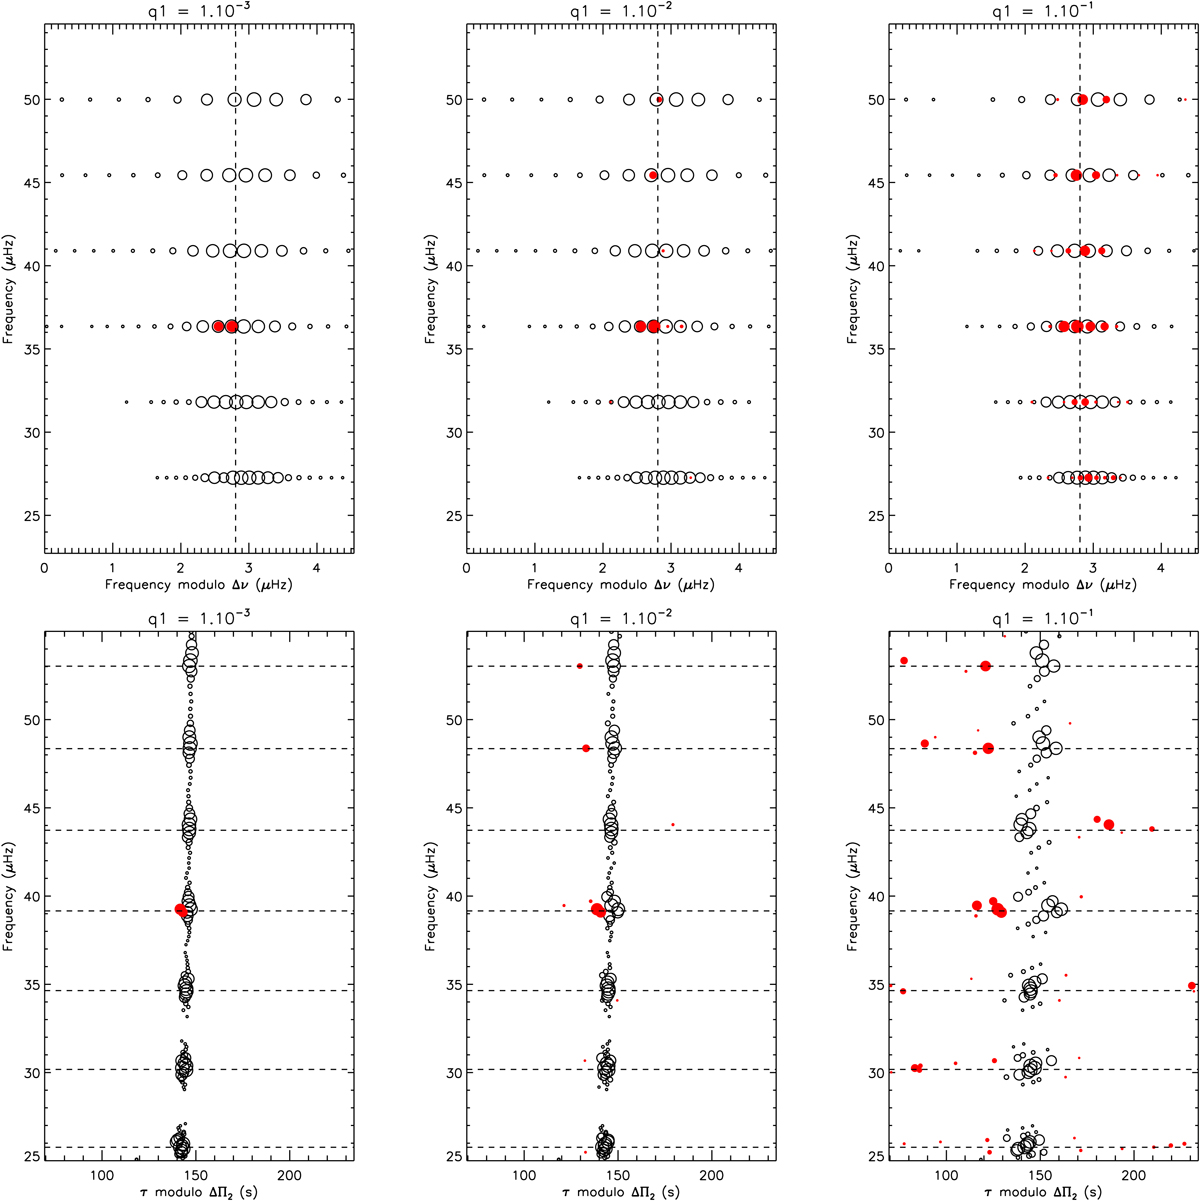
Échelle diagrams of the oscillation spectrum of model 1 obtained using the JWKB approximation, and assuming different coupling intensities between the g-mode cavities (q1 = 10−3, 10−2, 10−1from left to right panels). The size of the symbols indicates the expected height of each mode. For clarity, only the modes with a height corresponding to at least 10% of the height of a pure p mode are shown. Modes colored in red have at least 50% of their total energy trapped in the innermost g1 cavity (i.e., Ig1/I > 0.5). Top panels: frequency échelle diagrams folded with the large separation of acoustic modes Δν. Bottom panels: stretched period échelle diagrams built following Mosser et al. (2015, see text).
Current usage metrics show cumulative count of Article Views (full-text article views including HTML views, PDF and ePub downloads, according to the available data) and Abstracts Views on Vision4Press platform.
Data correspond to usage on the plateform after 2015. The current usage metrics is available 48-96 hours after online publication and is updated daily on week days.
Initial download of the metrics may take a while.