Fig. 12
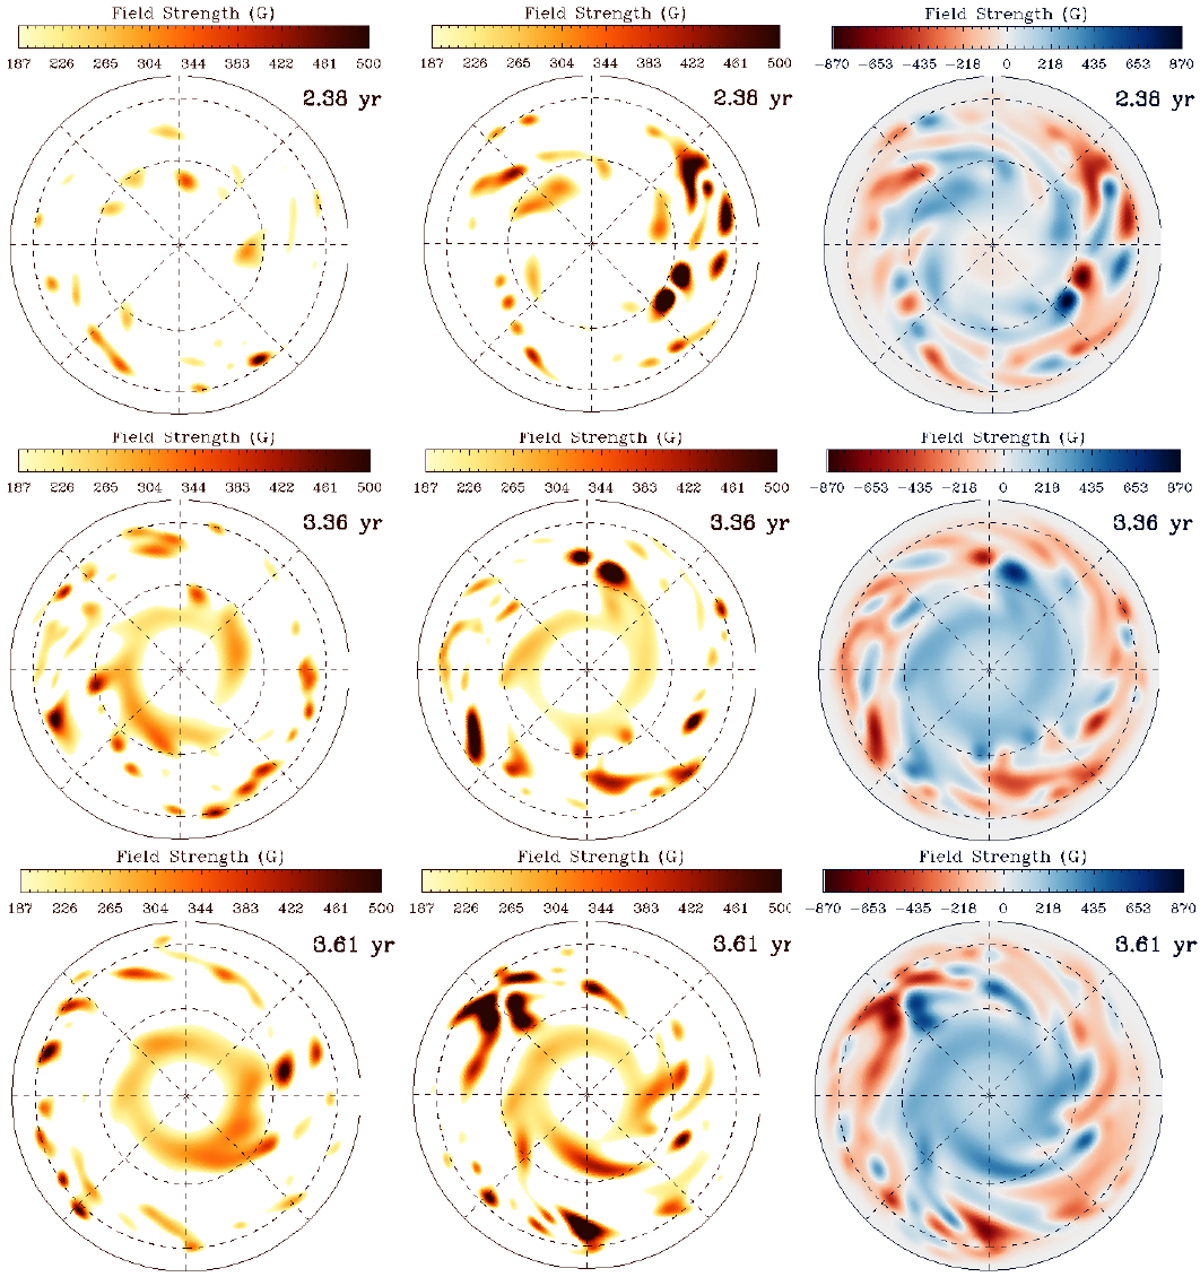
Pole-on views of the radial field, representing spot distributions for unnested (left column) and nested (middle column) cases for ![]() . The right column shows the corresponding signed magnetic field strength for the nested case, with a colour saturation at ± 870 G. Dotted circles represent the latitudes at 30° and 60°. We note that the spots are defined above 187 G.
. The right column shows the corresponding signed magnetic field strength for the nested case, with a colour saturation at ± 870 G. Dotted circles represent the latitudes at 30° and 60°. We note that the spots are defined above 187 G.
Current usage metrics show cumulative count of Article Views (full-text article views including HTML views, PDF and ePub downloads, according to the available data) and Abstracts Views on Vision4Press platform.
Data correspond to usage on the plateform after 2015. The current usage metrics is available 48-96 hours after online publication and is updated daily on week days.
Initial download of the metrics may take a while.