Free Access
Fig. 3.
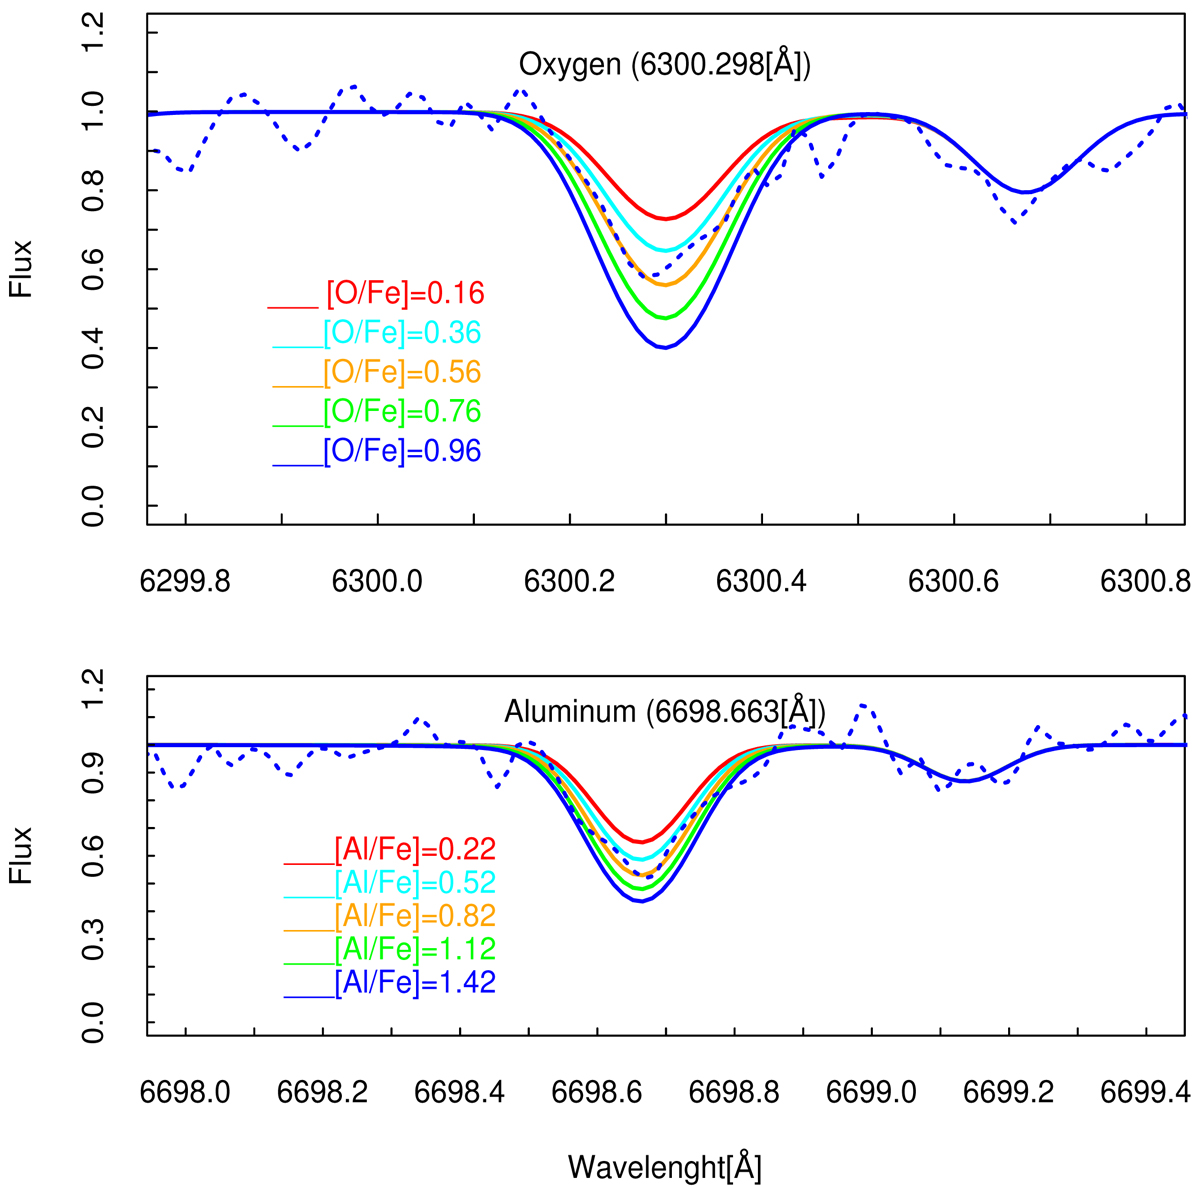
Spectrum synthesis fits for oxygen (star #5) and aluminum (star #5) lines, respectively. The dotted line is the observed spectrum and the solid color lines show the synthesized spectra corresponding to different abundances.
Current usage metrics show cumulative count of Article Views (full-text article views including HTML views, PDF and ePub downloads, according to the available data) and Abstracts Views on Vision4Press platform.
Data correspond to usage on the plateform after 2015. The current usage metrics is available 48-96 hours after online publication and is updated daily on week days.
Initial download of the metrics may take a while.