Fig. 3.
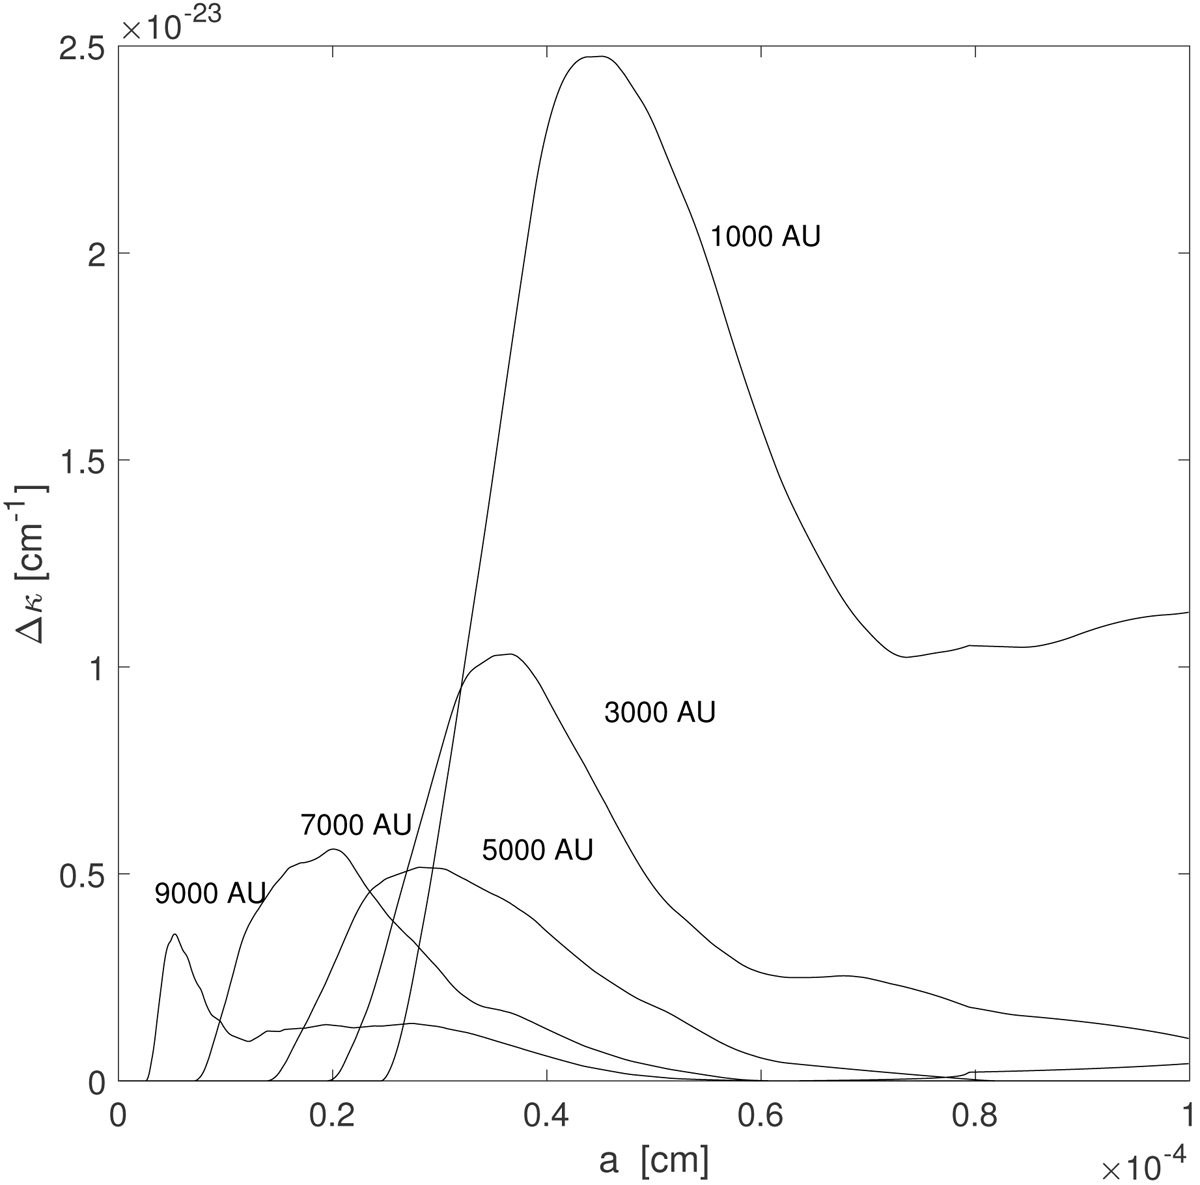
Contributions to the dust opacity for grains of different radii a, at different distances from the accreting star indicated at each curve in AU. The opacity contribution is given in cm−1, per logarithmic interval in a. The dominating contribution from grains on the order of a = amax in size, cf. Eq. (9), is seen in the inner regions, and is enhanced by the convergence of the flow, while at greater distances from the star the more numerous smaller grains contribute more, as a result of their initial motion inwards due to the starting condition v(rout)=vff. The curves have been smoothed by a filter with a width of 5 × 10⁻⁶ cm, to compensate for fluctuations due to the stochastic nature of the method used.
Current usage metrics show cumulative count of Article Views (full-text article views including HTML views, PDF and ePub downloads, according to the available data) and Abstracts Views on Vision4Press platform.
Data correspond to usage on the plateform after 2015. The current usage metrics is available 48-96 hours after online publication and is updated daily on week days.
Initial download of the metrics may take a while.