Fig. 8.
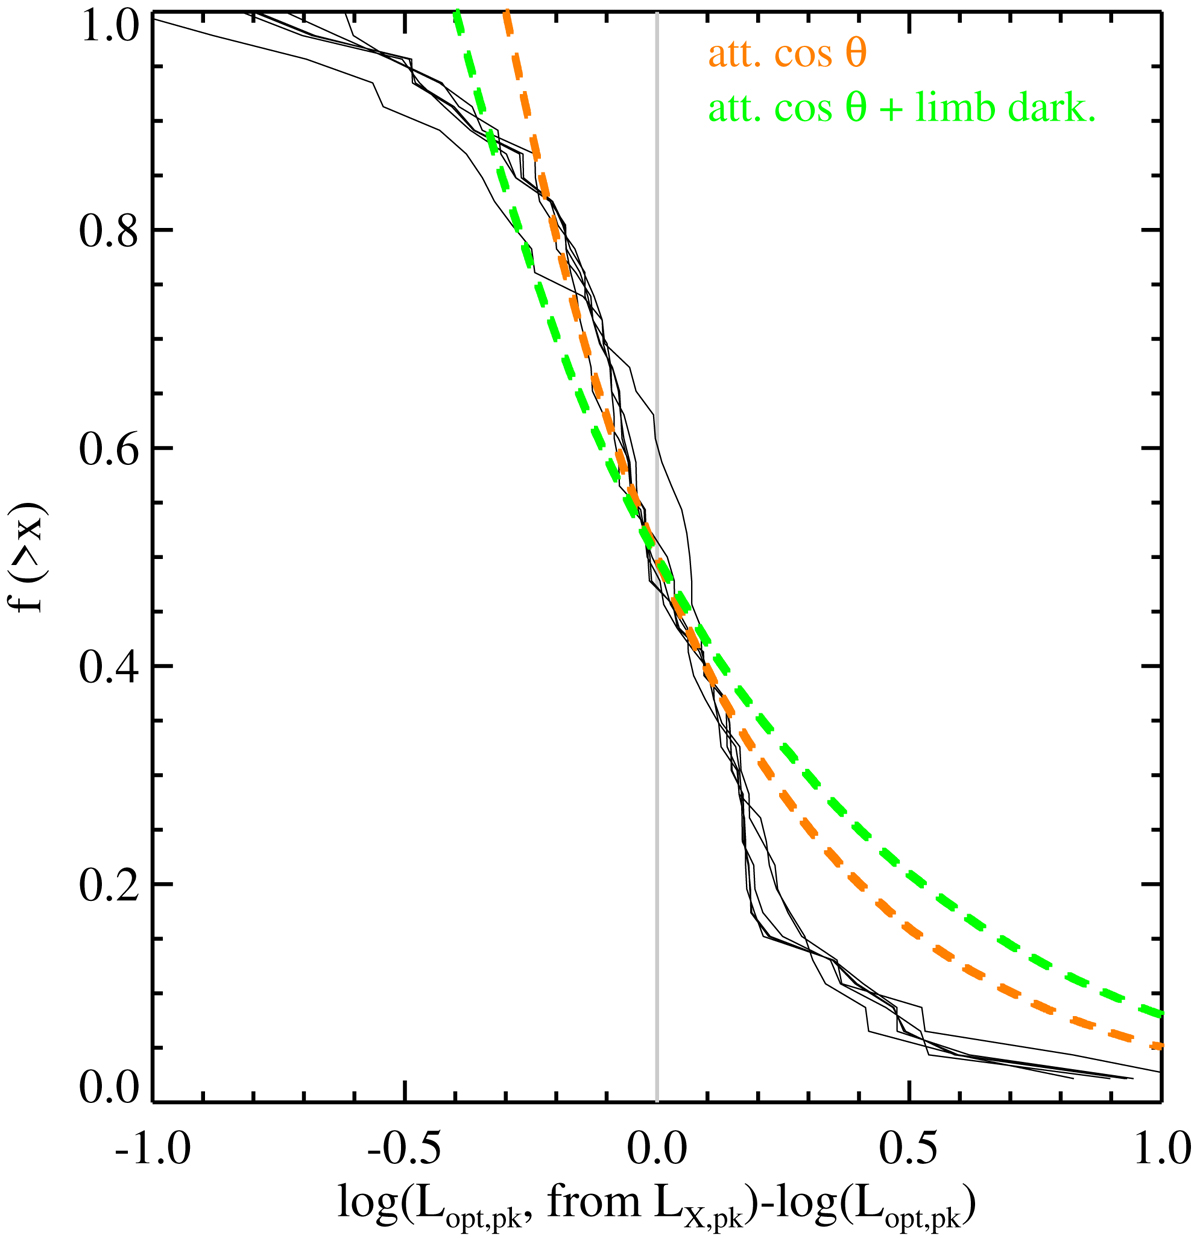
Solid black lines: cumulative distributions of residuals in the linear fits to the log Lopt, pk vs. log LX, pk scatter plot. Each line refers to one of the six linear fits shown in Fig. 3. Dashed orange line: predicted distributions assuming the optical peak luminosity is perfectly correlated to the X-ray peak luminosity and that the observed optical flux, from an optically thick slab-like region, is attenuated by projection effects (see text). Dashed green line: same as above with an additional attenuation due to limb darkening. The fact that the observed scatter is smaller than predicted by these assumption, even ignoring measurement uncertainties and flare-to-flare variations, indicates that the assumptions on the optical emitting regions are not correct.
Current usage metrics show cumulative count of Article Views (full-text article views including HTML views, PDF and ePub downloads, according to the available data) and Abstracts Views on Vision4Press platform.
Data correspond to usage on the plateform after 2015. The current usage metrics is available 48-96 hours after online publication and is updated daily on week days.
Initial download of the metrics may take a while.