Fig. 7.
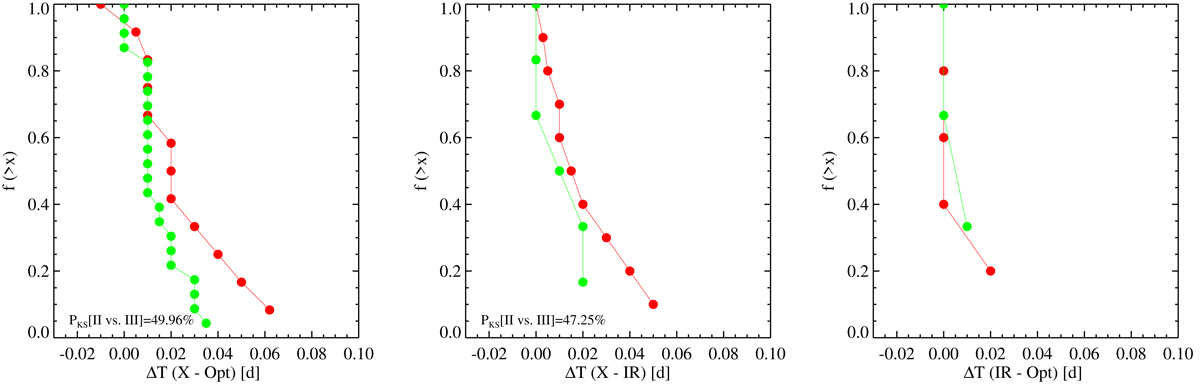
Distributions of time delays between the flare start times in the optical band vs. X-rays (left panel), IR vs. X-rays (center), and optical vs. IR bands (right). Distributions for flares on Class II and Class III stars are plotted separately in each panel in red and green, respectively. The results of KS tests comparing the two distributions are shown in the lower-left corner, indicating in all cases that the distributions are not significantly different.
Current usage metrics show cumulative count of Article Views (full-text article views including HTML views, PDF and ePub downloads, according to the available data) and Abstracts Views on Vision4Press platform.
Data correspond to usage on the plateform after 2015. The current usage metrics is available 48-96 hours after online publication and is updated daily on week days.
Initial download of the metrics may take a while.