Fig. 4.
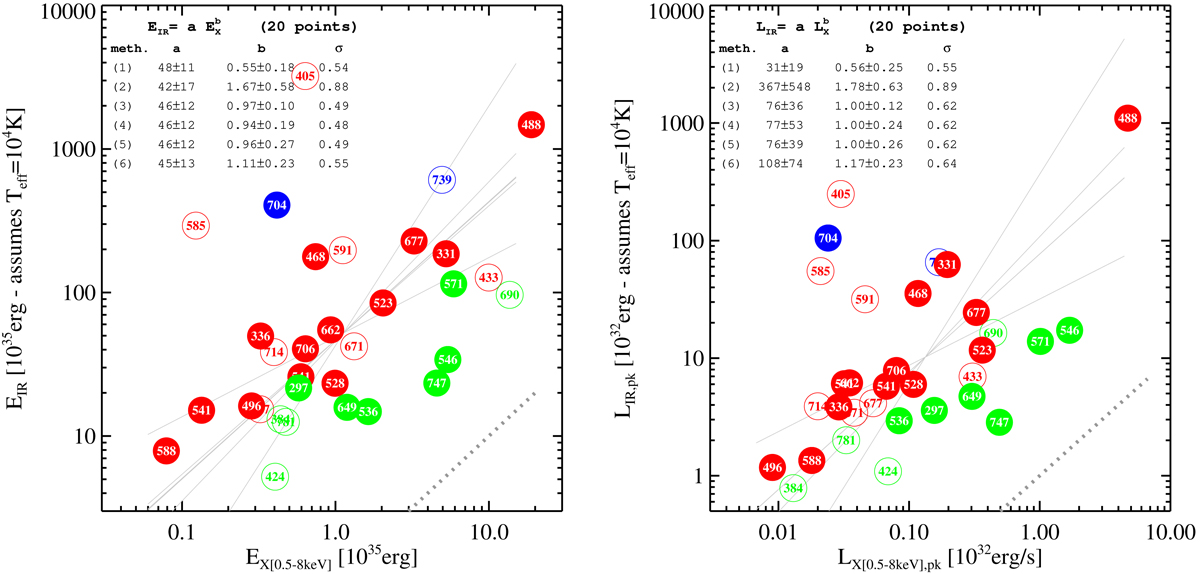
Left: bolometric flare emitted energy, estimated from the Spitzer lightcurves assuming a 104 K black body spectrum, EIR, vs. EX the energy emitted in the 0.5–8.0 keV band. Symbols and lines as in Fig. 3/5, with the addition of blue circles, which indicate flares from Class I sources. Right: same as the plot on the left, but for peak luminosities instead of energies.
Current usage metrics show cumulative count of Article Views (full-text article views including HTML views, PDF and ePub downloads, according to the available data) and Abstracts Views on Vision4Press platform.
Data correspond to usage on the plateform after 2015. The current usage metrics is available 48-96 hours after online publication and is updated daily on week days.
Initial download of the metrics may take a while.