Fig. 3.
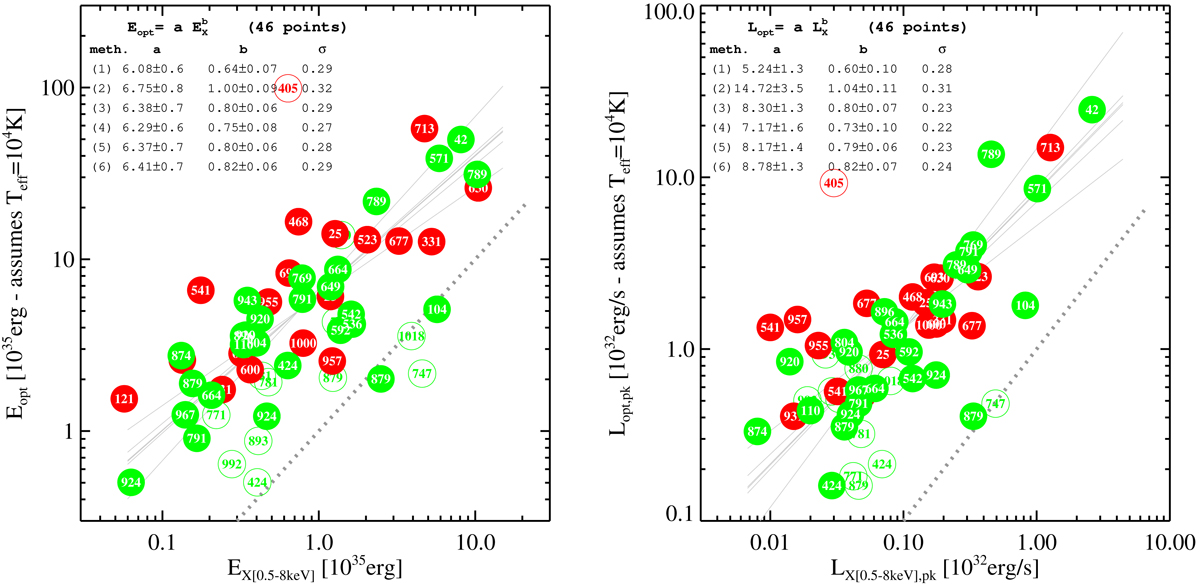
Left: total “bolometric” emitted energy, Eopt, estimated from the CoRoT lightcurves (see text) vs. energy emitted in the 0.5–8.0 keV band, EX. Green and red circles indicate flares from Class III and Class II stars, respectively. Filled circles refer to the flares in our main samples, empty ones to flares with particularly uncertain estimates. The dashed lines shows the unit relation, while the solid lines show the results of six different linear fits (in the log–log plane) performed with different methods, and whose parameters are shown in the upper part of the panel along with the 1σ dispersion of residuals. The fitting methods are: (1) Ordinary Least Squares Y vs. X, (2) Ordinary Least Squares X vs. Y, (3) Ordinary Least Squares Bisector, (4) Orthogonal Reduced Major Axis, (5) Reduced Major-Axis, (6) Mean ordinary Least Squares. Right: same as the plot on the left, but for peak luminosities instead of energies.
Current usage metrics show cumulative count of Article Views (full-text article views including HTML views, PDF and ePub downloads, according to the available data) and Abstracts Views on Vision4Press platform.
Data correspond to usage on the plateform after 2015. The current usage metrics is available 48-96 hours after online publication and is updated daily on week days.
Initial download of the metrics may take a while.