Fig. A.3.
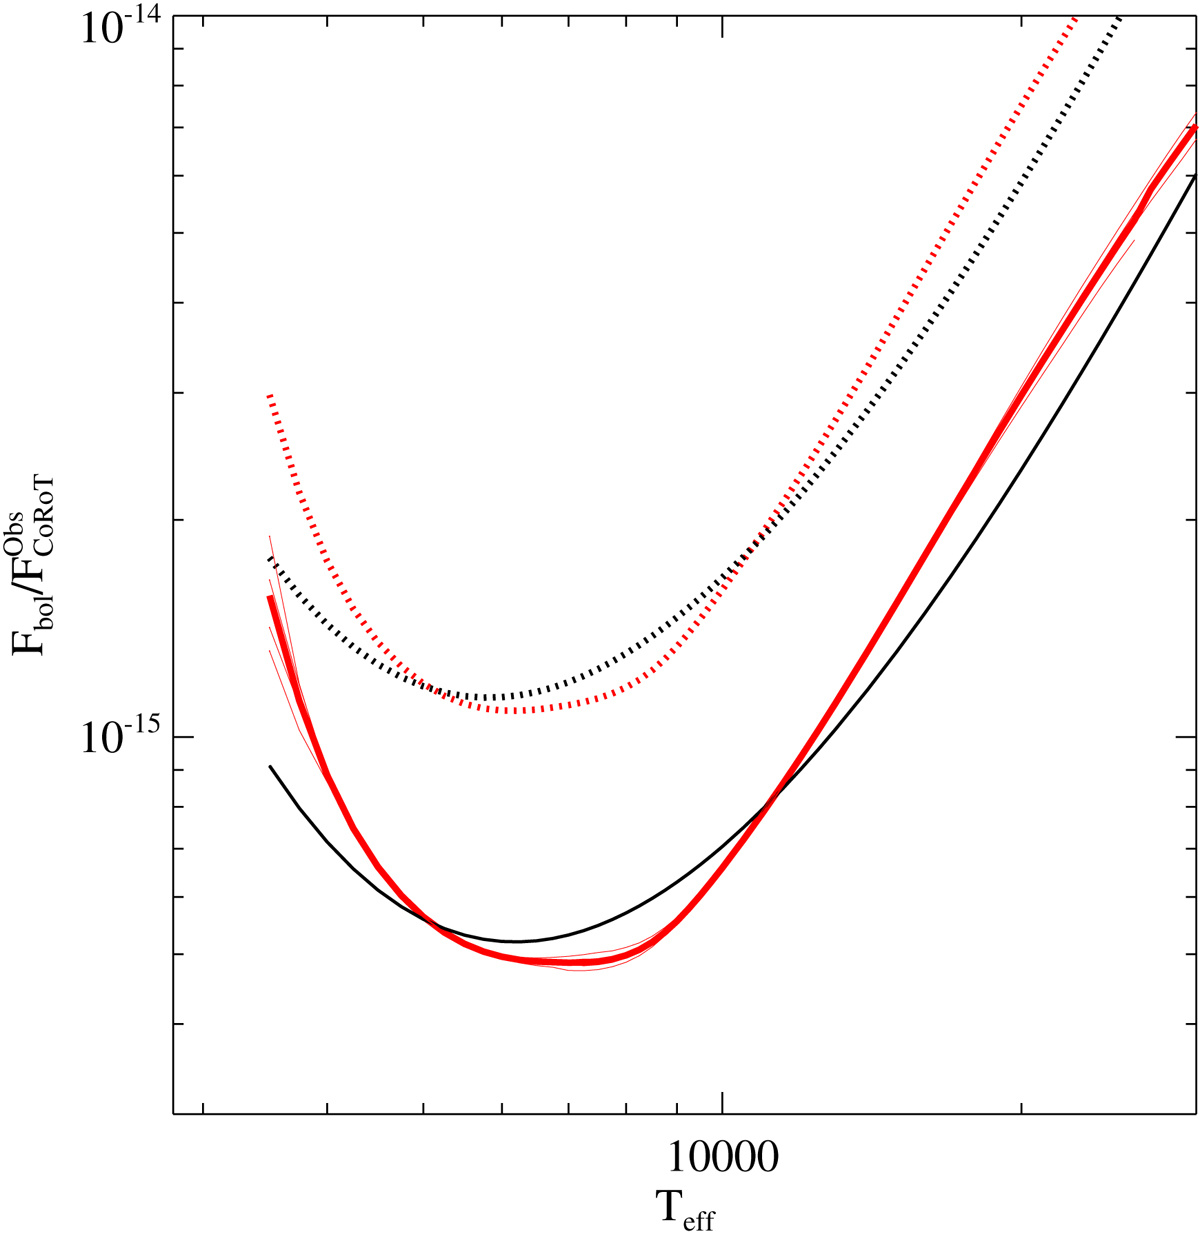
Conversion factor between observed CoRoT flux and bolometric flux as a function of spectral parameters/shape and extinction. The ![]() ratio is plotted as a function of temperature for different source spectra. All solid lines refer to unabsorbed source spectra. The four thin red lines refer the stellar case with four values of log g between 3.0 and 4.5. The thicker red line shows the mean of the four values at each Teff. The black line refers instead to black body emission spectra. The dotted red and black lines show the
ratio is plotted as a function of temperature for different source spectra. All solid lines refer to unabsorbed source spectra. The four thin red lines refer the stellar case with four values of log g between 3.0 and 4.5. The thicker red line shows the mean of the four values at each Teff. The black line refers instead to black body emission spectra. The dotted red and black lines show the ![]() ratio for the stellar and black-body cases, respectively, for an AV = 1.0 mag interstellar extinction.
ratio for the stellar and black-body cases, respectively, for an AV = 1.0 mag interstellar extinction.
Current usage metrics show cumulative count of Article Views (full-text article views including HTML views, PDF and ePub downloads, according to the available data) and Abstracts Views on Vision4Press platform.
Data correspond to usage on the plateform after 2015. The current usage metrics is available 48-96 hours after online publication and is updated daily on week days.
Initial download of the metrics may take a while.