Fig. A.2.
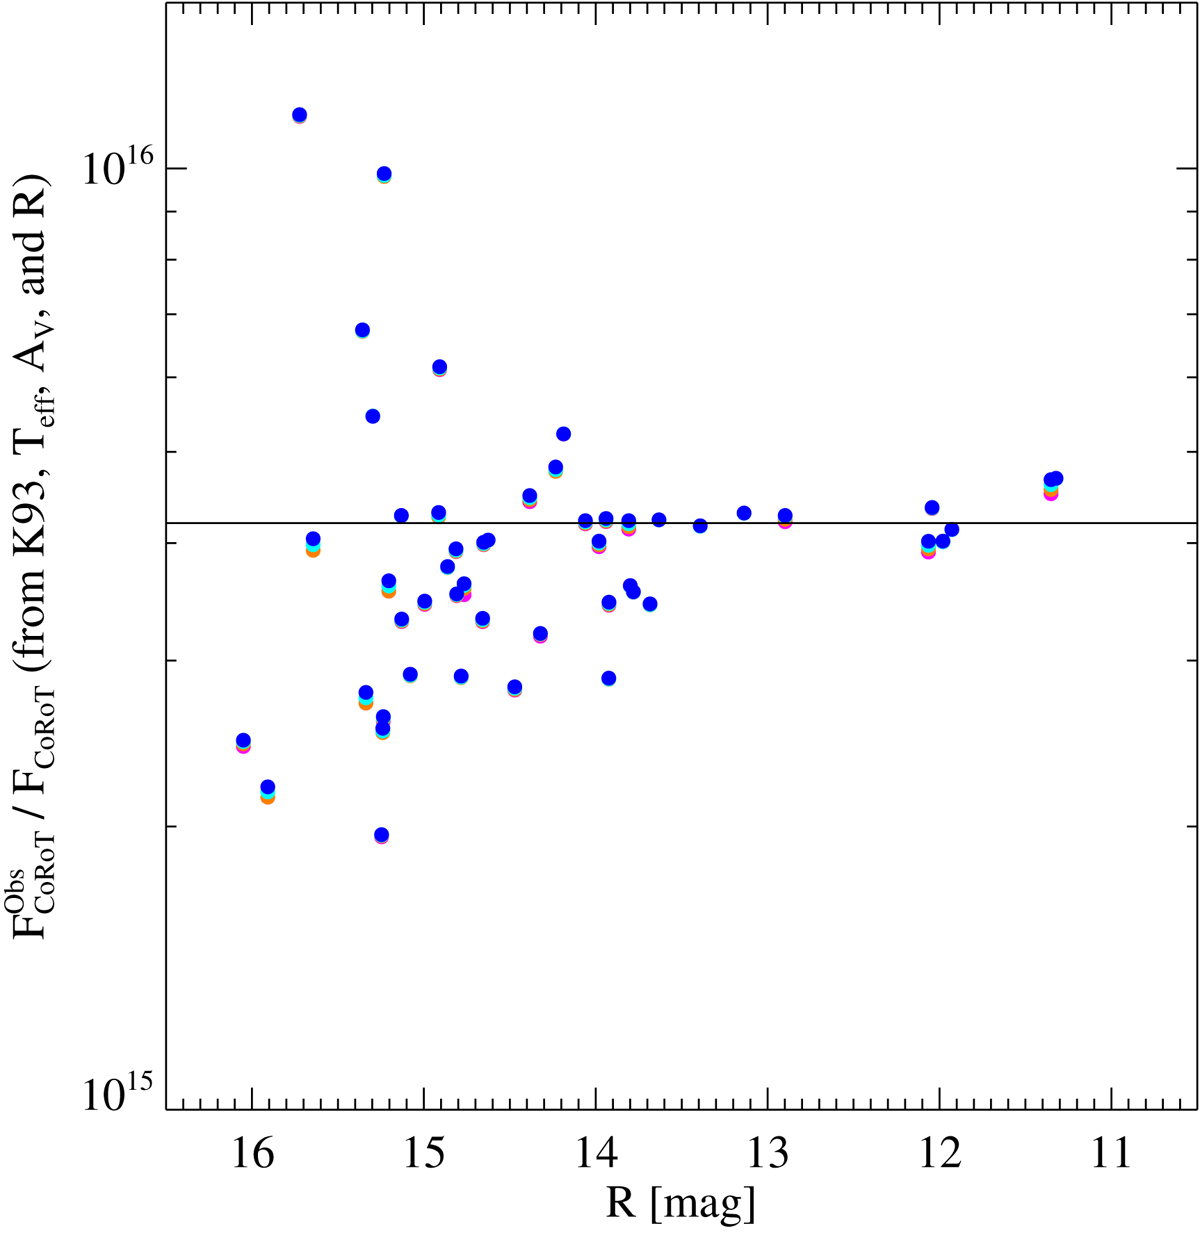
Ratio between observed CoRoT flux, in instrumental units, and the flux predicted from model spectra vs. observed R magnitudes. The plotted points refer to a subsample of suitable and well characterized NGC 2264 members (see text), and symbols of different colors, largely overlapping with each other, refer to estimates obtained assuming four different values of log g between 3.0 and 4.5. The horizontal line refers to the adopted value, 4.2 × 10¹⁵ erg−1 s−1 cm−2.
Current usage metrics show cumulative count of Article Views (full-text article views including HTML views, PDF and ePub downloads, according to the available data) and Abstracts Views on Vision4Press platform.
Data correspond to usage on the plateform after 2015. The current usage metrics is available 48-96 hours after online publication and is updated daily on week days.
Initial download of the metrics may take a while.