Fig. 4.
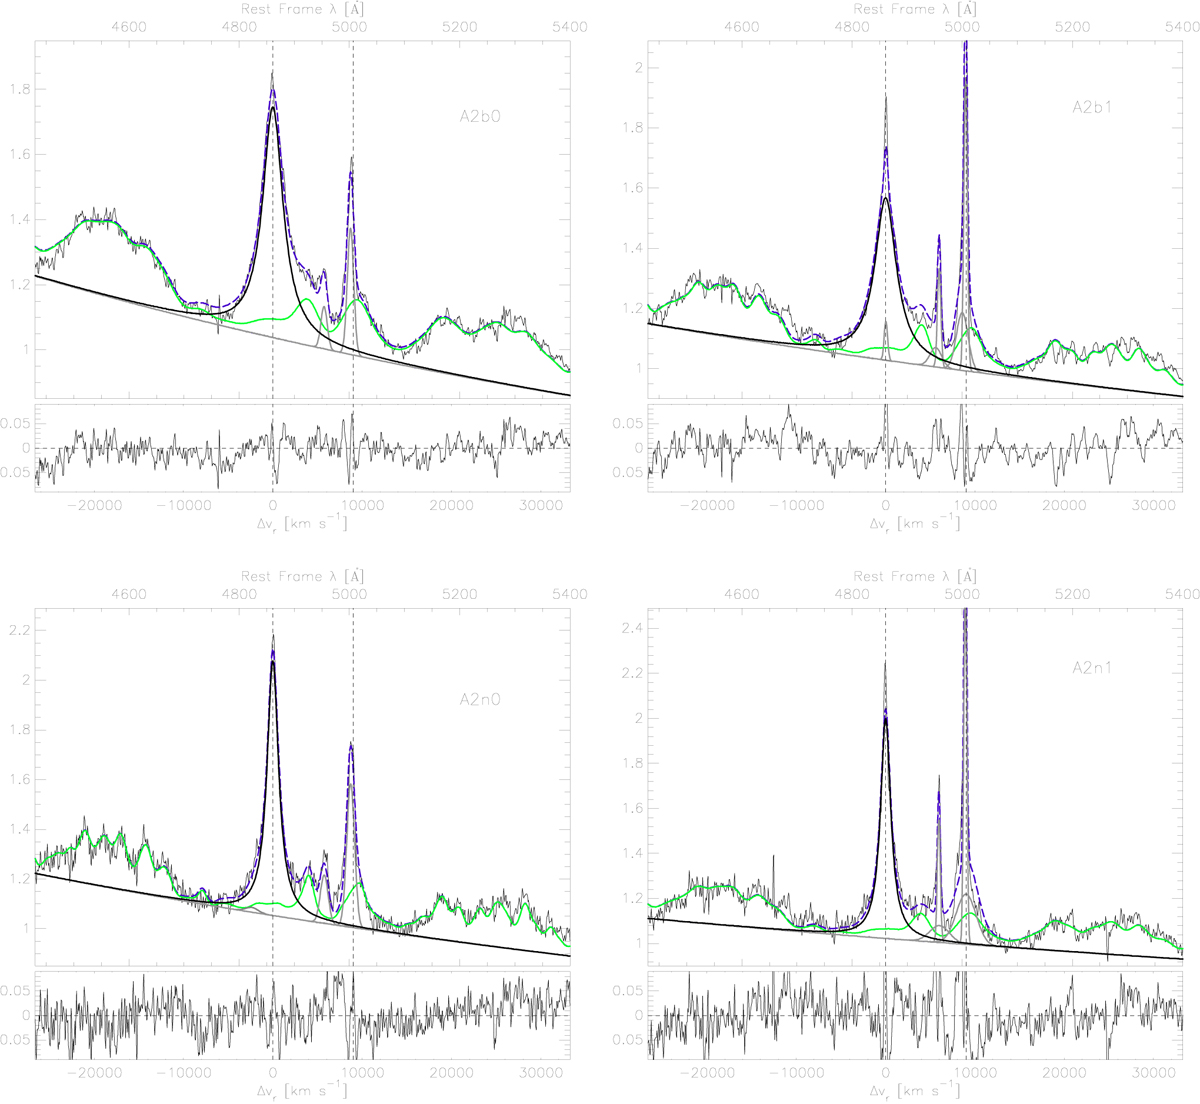
Fits of the spectral type composite spectrum A2 for four spectral sub-types: A2b0: broad line and weak [OIII]; A2b1: broad line and strong [OIII]; A2n0: narrow line and weak [OIII]; A2n1: narrow line and strong [OIII]. The original spectrum is shown superimposed to the adopted continuum (thick black line) and to Fe II emission (thin green line). The HβBC fitting functions are shown in black and gray (the blue shifted component). The long-dashed purple lines are the fits. Dashed vertical lines identify the rest-frame wavelengths of Hβ and [OIII]. The lower panels show the residuals to the fits.
Current usage metrics show cumulative count of Article Views (full-text article views including HTML views, PDF and ePub downloads, according to the available data) and Abstracts Views on Vision4Press platform.
Data correspond to usage on the plateform after 2015. The current usage metrics is available 48-96 hours after online publication and is updated daily on week days.
Initial download of the metrics may take a while.