Free Access
Fig. 14.
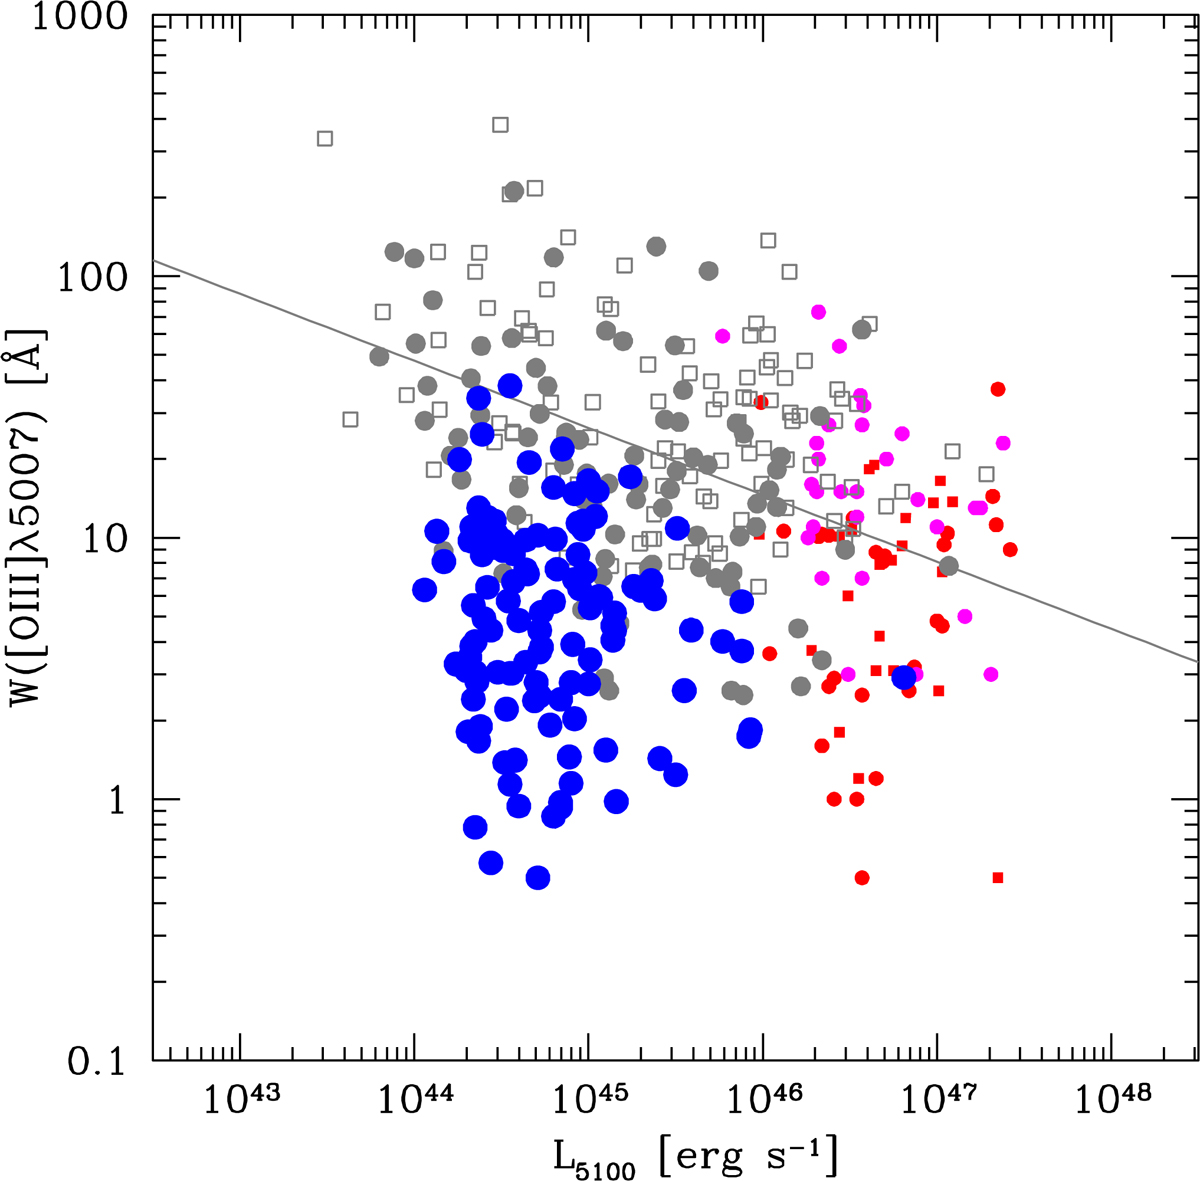
Relation between W [OIII] and 5100 Å luminosity for the cosmo sample and the total [OIII] SB+NC emission. Red color: Sulentic et al. (2017); purple: Netzer et al. (2004); gray: low-z sample (Marziani et al. 2003). Open squares are Pop. B, filled circles Pop. A. The cosmo sample data points are shown as filled blue circles.
Current usage metrics show cumulative count of Article Views (full-text article views including HTML views, PDF and ePub downloads, according to the available data) and Abstracts Views on Vision4Press platform.
Data correspond to usage on the plateform after 2015. The current usage metrics is available 48-96 hours after online publication and is updated daily on week days.
Initial download of the metrics may take a while.