Free Access
Fig. 12.
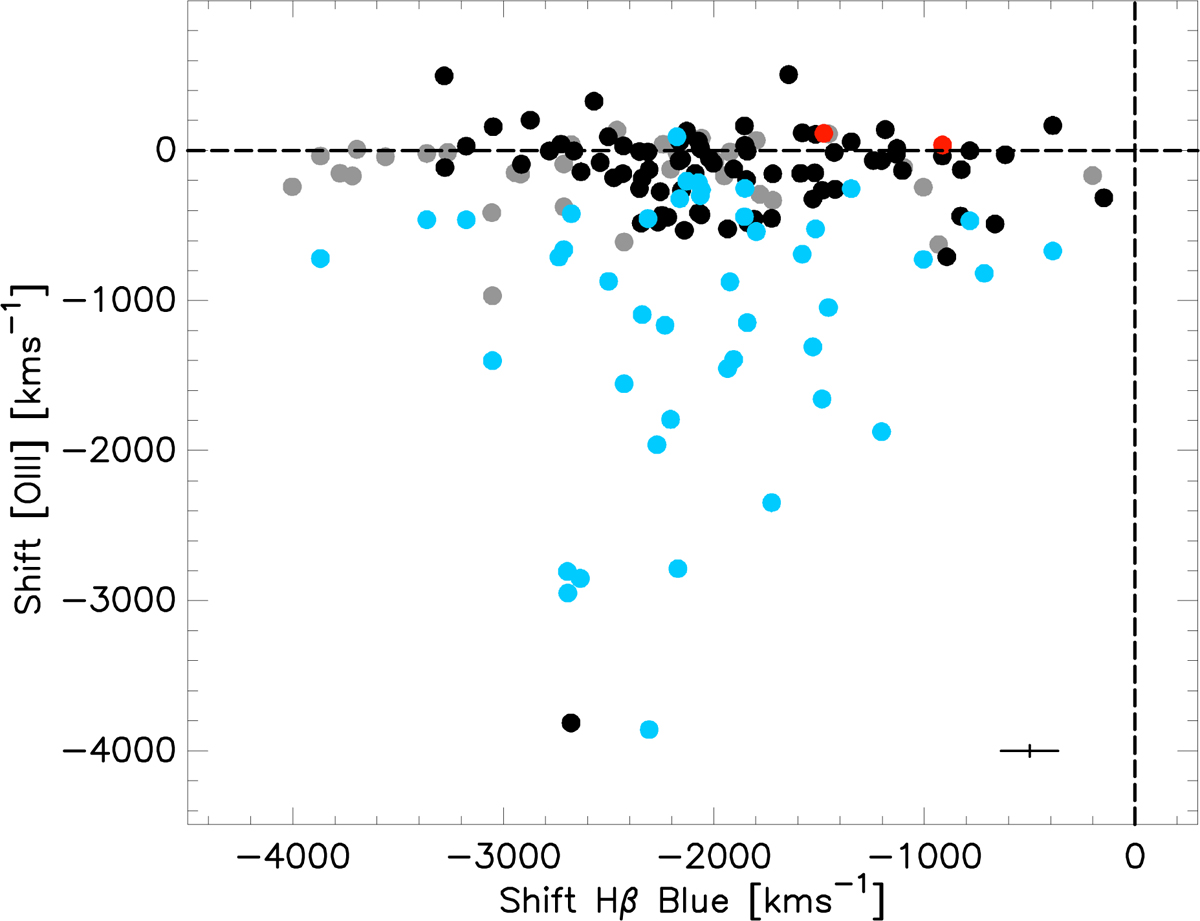
Line shifts of Hβ BLUE vs. shift of [OIII]. Meaning of symbols is as for Fig. 1, with the addition of pale blue dots that represent sources whose [OIII] peak shift emission is due to the semi-broad component. Dotted lines are zero shifts.
Current usage metrics show cumulative count of Article Views (full-text article views including HTML views, PDF and ePub downloads, according to the available data) and Abstracts Views on Vision4Press platform.
Data correspond to usage on the plateform after 2015. The current usage metrics is available 48-96 hours after online publication and is updated daily on week days.
Initial download of the metrics may take a while.