Fig. 11.
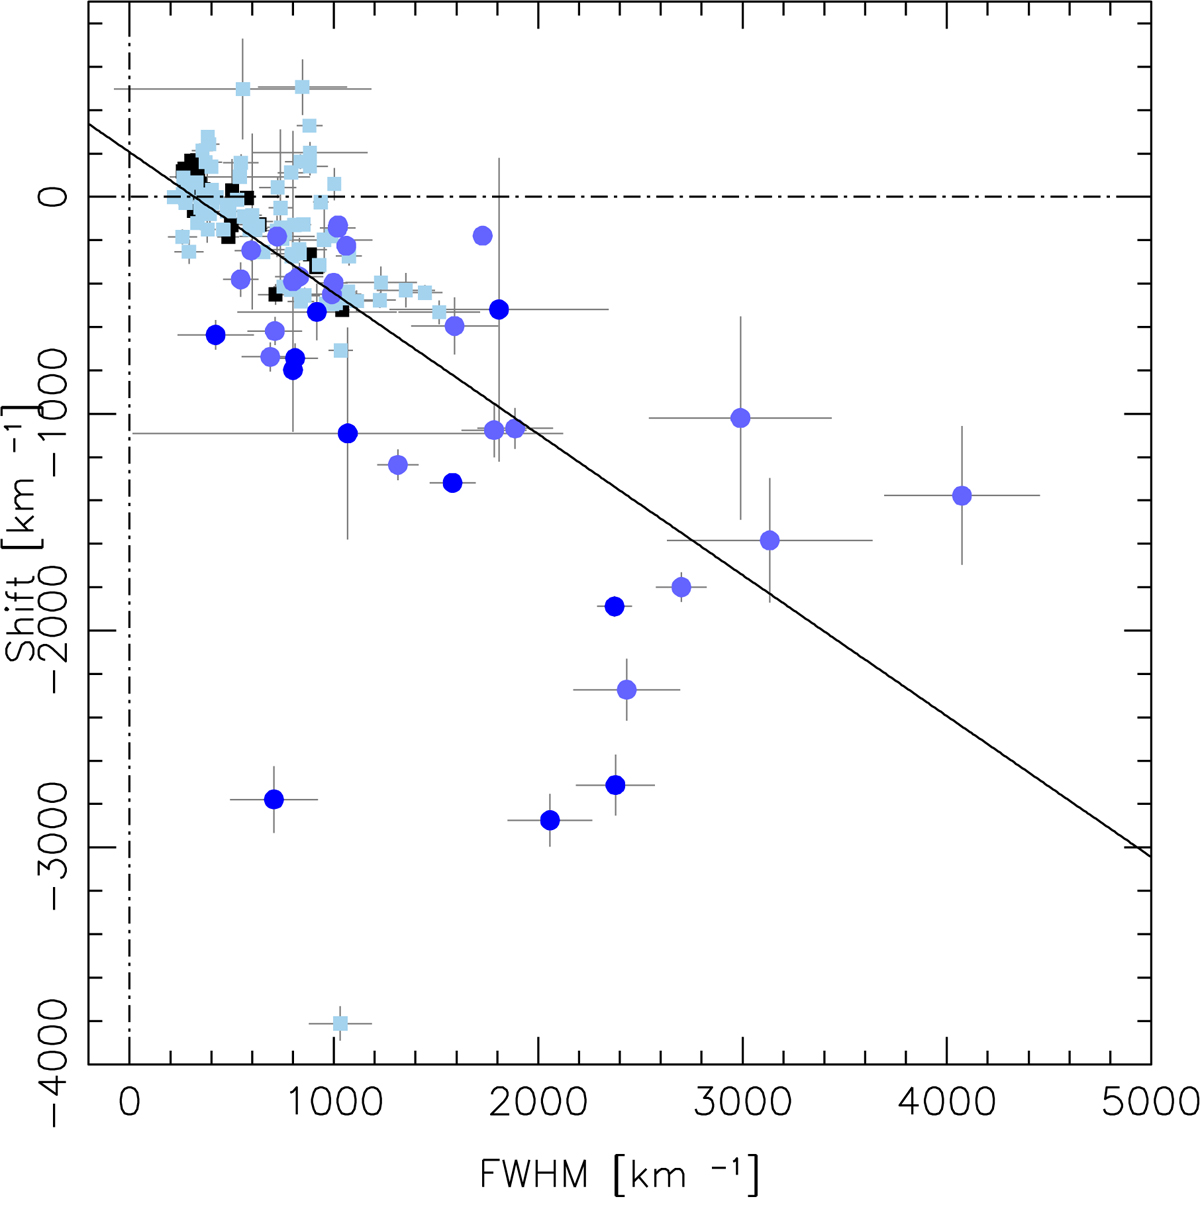
Line shifts vs. FWHM for the Pop. A objects. For the objects in which both [OIII] NC and SB were fitted, the black squares represents the NC while the SB component is in light blue circles. The sources fitted with a single NC are plotted in pale blue squares, while the ones with only a SB component are represented by darker blue circles.
Current usage metrics show cumulative count of Article Views (full-text article views including HTML views, PDF and ePub downloads, according to the available data) and Abstracts Views on Vision4Press platform.
Data correspond to usage on the plateform after 2015. The current usage metrics is available 48-96 hours after online publication and is updated daily on week days.
Initial download of the metrics may take a while.