Free Access
Fig. 9.
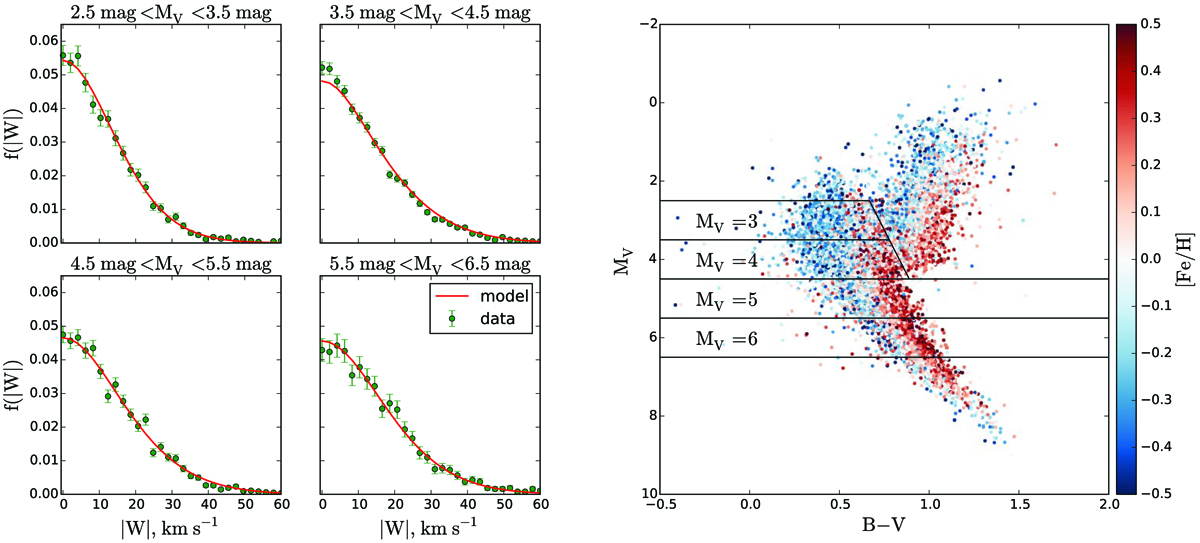
Normalised velocity distribution functions f(|W|) for the different MV cuts. The selection of the MS stars and separation into magnitude bins is shown on the right, where the CMD of the full TGAS×RAVE thin-disc sample is plotted with APASS photometry and the RAVE metallicity is colour-coded.
Current usage metrics show cumulative count of Article Views (full-text article views including HTML views, PDF and ePub downloads, according to the available data) and Abstracts Views on Vision4Press platform.
Data correspond to usage on the plateform after 2015. The current usage metrics is available 48-96 hours after online publication and is updated daily on week days.
Initial download of the metrics may take a while.