Fig. 6.
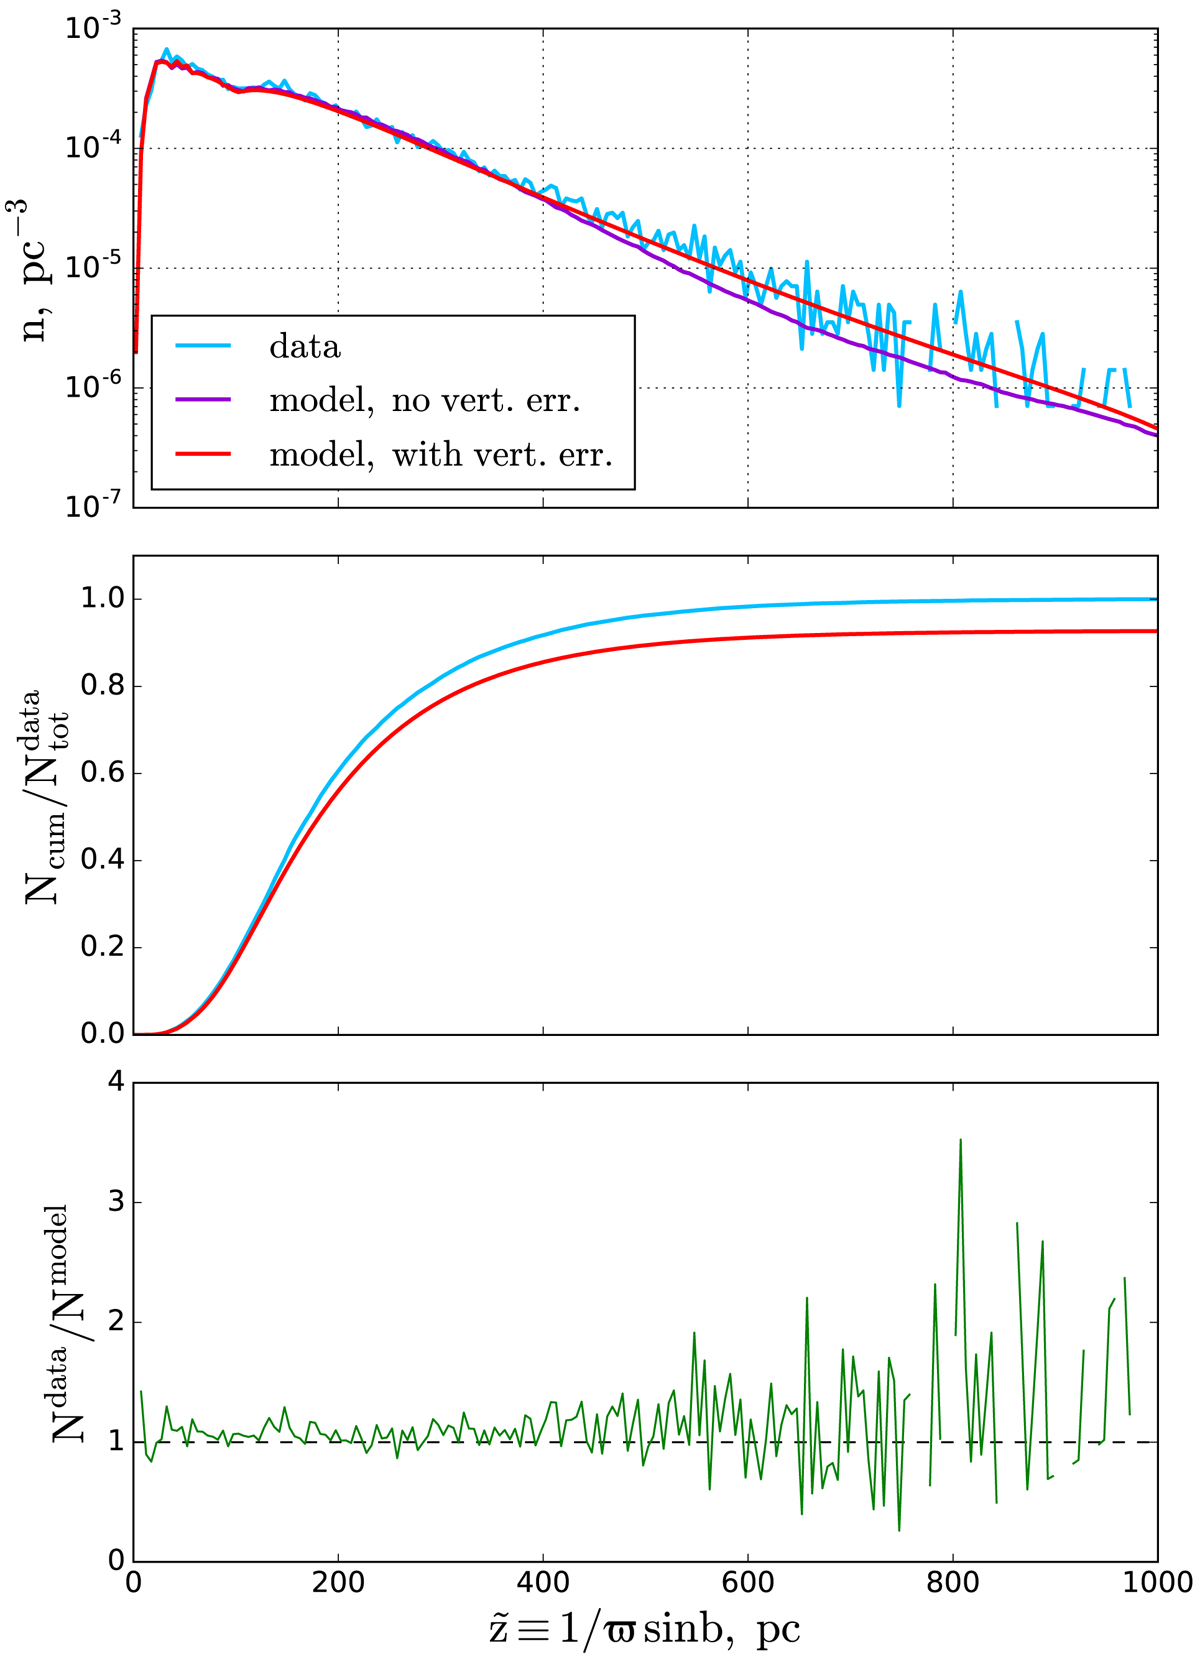
Top: volume number density of stars in the modelled cylinder. The blue line represents the data, and violet and red curves are the model predictions before and after the vertical error effect is taken into account. Middle: cumulative number of stars in the cylinder as a function of observed height ![]() . The values are normalised to the total number of stars in the TGAS×RAVE thin-disc sample. Bottom: ratio of the observed to predicted number of stars in the vertical bins.
. The values are normalised to the total number of stars in the TGAS×RAVE thin-disc sample. Bottom: ratio of the observed to predicted number of stars in the vertical bins.
Current usage metrics show cumulative count of Article Views (full-text article views including HTML views, PDF and ePub downloads, according to the available data) and Abstracts Views on Vision4Press platform.
Data correspond to usage on the plateform after 2015. The current usage metrics is available 48-96 hours after online publication and is updated daily on week days.
Initial download of the metrics may take a while.