Fig. 5.
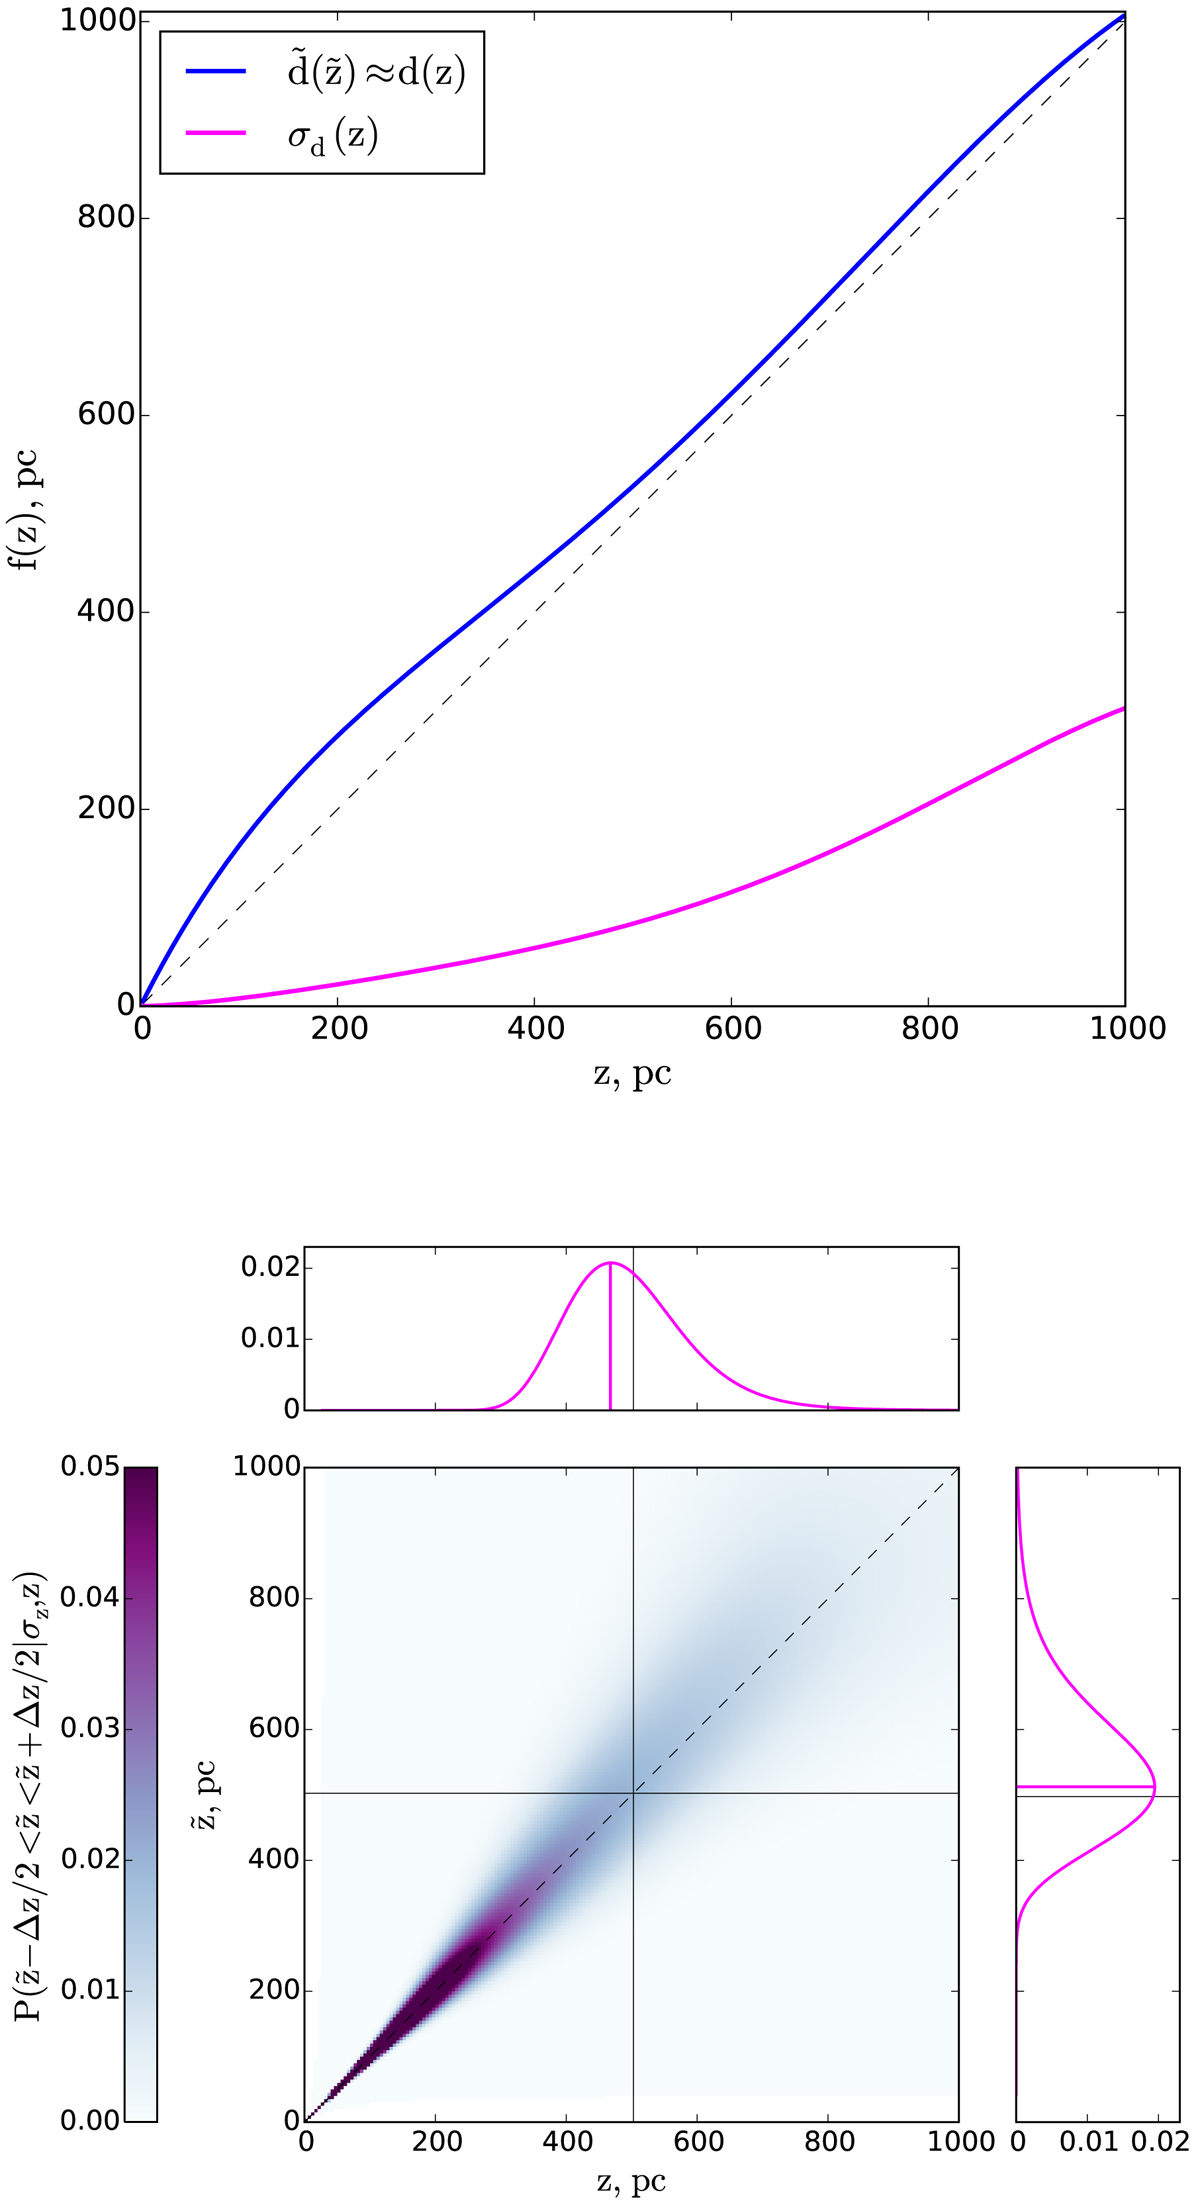
Top: mean observed heliocentric distance ![]() vs. height
vs. height ![]() as derived from the data (blue curve). The thin-disc sample was binned in
as derived from the data (blue curve). The thin-disc sample was binned in ![]() and at each height, the mean heliocentric distance was calculated. The observed dependence was fitted with a polynom of the fifth order to obtain a smooth function. The distance error as a function of height was then derived with the derived mean distance (magenta curve). Bottom: diagram showing the vertical effect of the distance error. The normalised probability for a true height z to be associated with the observed distance from the midplane
and at each height, the mean heliocentric distance was calculated. The observed dependence was fitted with a polynom of the fifth order to obtain a smooth function. The distance error as a function of height was then derived with the derived mean distance (magenta curve). Bottom: diagram showing the vertical effect of the distance error. The normalised probability for a true height z to be associated with the observed distance from the midplane ![]() given the thin-disc sample geometry and the typical distance errors from the top panel is colour-coded. The horizontal and vertical projections are example PDFs
given the thin-disc sample geometry and the typical distance errors from the top panel is colour-coded. The horizontal and vertical projections are example PDFs ![]() and
and ![]() for the true and observed heights of 0.5 kpc. The skewness of the two distributions results in two effects: (1) an individual star is more likely to be observed at a height larger than its true distance from the midplane, and (2) the observations at some
for the true and observed heights of 0.5 kpc. The skewness of the two distributions results in two effects: (1) an individual star is more likely to be observed at a height larger than its true distance from the midplane, and (2) the observations at some ![]() are more likely to be affected by smaller heights. The magenta lines in the projection subplots show distribution maxima.
are more likely to be affected by smaller heights. The magenta lines in the projection subplots show distribution maxima.
Current usage metrics show cumulative count of Article Views (full-text article views including HTML views, PDF and ePub downloads, according to the available data) and Abstracts Views on Vision4Press platform.
Data correspond to usage on the plateform after 2015. The current usage metrics is available 48-96 hours after online publication and is updated daily on week days.
Initial download of the metrics may take a while.