Free Access
Fig. 3.
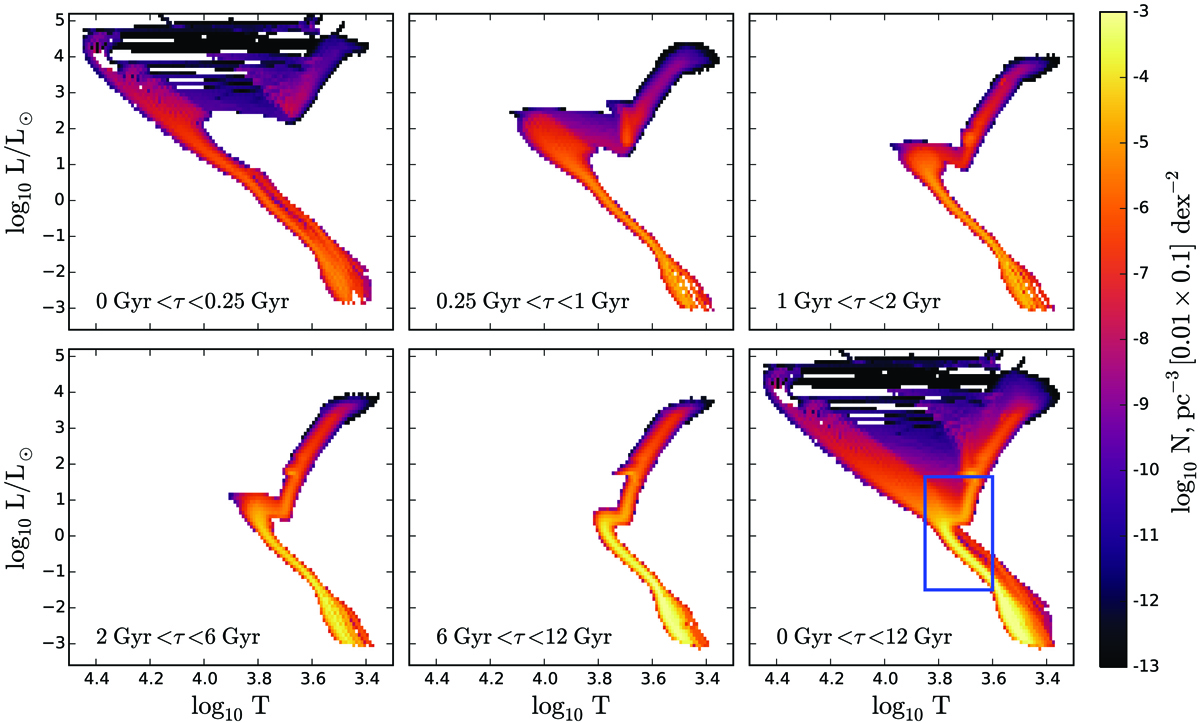
Theoretical HR diagrams for the thin disc as predicted by the local JJ model with the use of MIST isochrones. Five age bins illustrate the contributions from the different thin-disc populations to the total HR diagram (lower right). The blue box roughly corresponds to the region studied in this work.
Current usage metrics show cumulative count of Article Views (full-text article views including HTML views, PDF and ePub downloads, according to the available data) and Abstracts Views on Vision4Press platform.
Data correspond to usage on the plateform after 2015. The current usage metrics is available 48-96 hours after online publication and is updated daily on week days.
Initial download of the metrics may take a while.