Fig. 2.
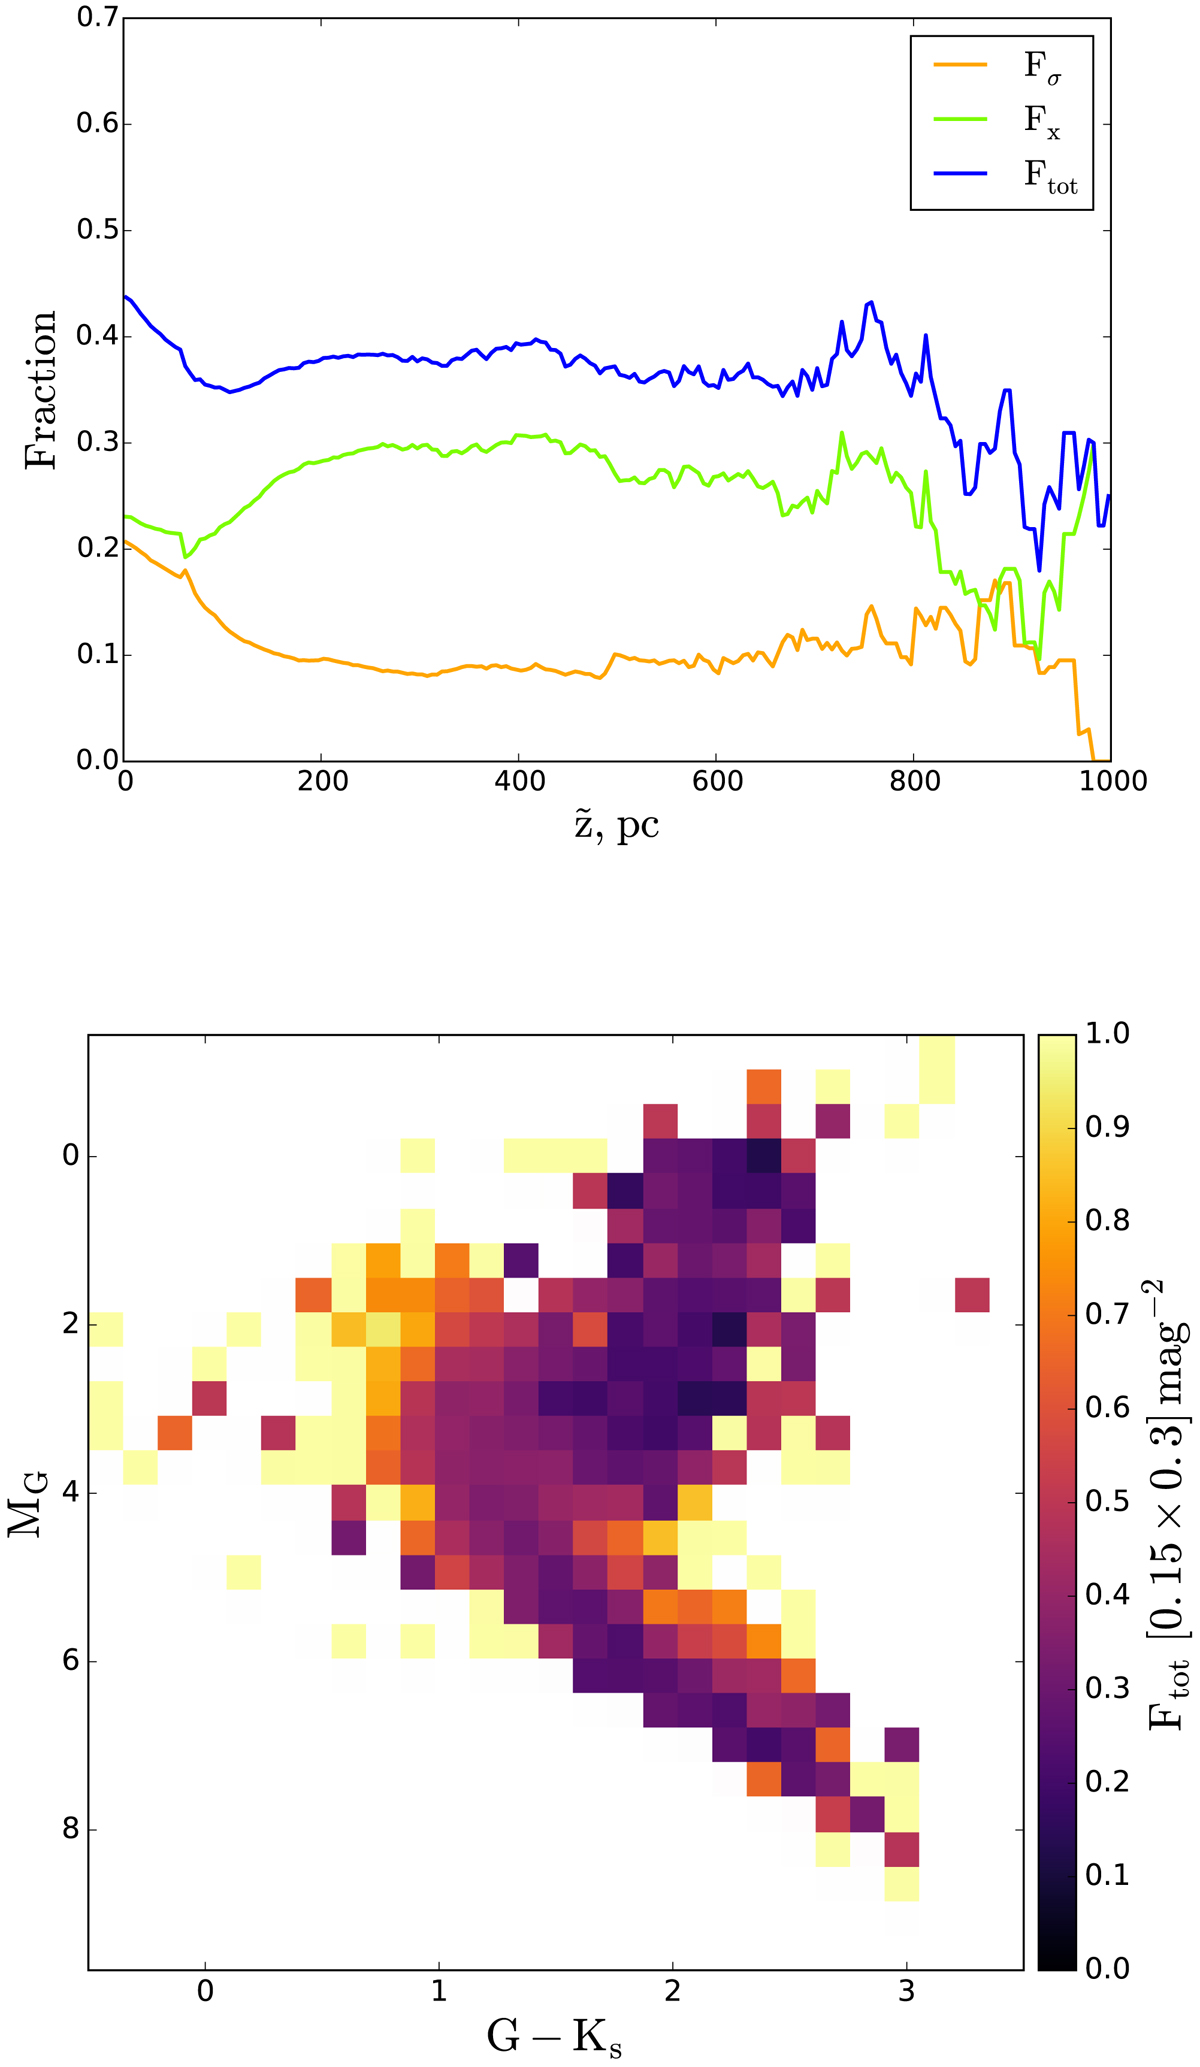
Top: fraction of stars missing in the solar cylinder of 300 pc radius and 1 kpc height below the midplane. The orange line corresponds to the contribution from the low-quality stars, and the green curve gives an upper limit on the fraction of stars that did not enter the final sample because of the missing chemical abundances. The total fraction of missing stars is shown in blue. Bottom: total fraction of the missing stars as a function of absolute G magnitude and G − Ks colour.
Current usage metrics show cumulative count of Article Views (full-text article views including HTML views, PDF and ePub downloads, according to the available data) and Abstracts Views on Vision4Press platform.
Data correspond to usage on the plateform after 2015. The current usage metrics is available 48-96 hours after online publication and is updated daily on week days.
Initial download of the metrics may take a while.